

Table of Contents
“There’s more to it than that meets the eye.” If you are a “Transformers” fan, you would have read this in Optimus Prime’s voice in your head. This article will give more insight into how logs are much more than what you see.
Introduction
Logs are records of events or messages generated by software applications. They capture important information about the behaviour and state of the system, allowing developers, administrators, and other stakeholders to understand and troubleshoot issues, monitor performance, and gain insights into system operations. Some key aspects of logs:
- Debugging
- Monitoring
- Troubleshooting
- Auditing
At Cashfree Payments, we use ElasticSearch, Logstash, and Kibana as our complete logging platform, which collects all the logs from different services and provides features for filtering and analyzing logs. Along with this, we also have other analytic tool integrations where metrics are captured and this provides fast feedback on specific and commonly used system measurements (latencies of APIs, status codes by API, and many more).
While log traces (logs) and metrics help in understanding the behavior of the system (journey of one request), querying on these multiple logs to gather the entire information of a request and gathering concrete information out of it becomes cumbersome. This is where canonical log lines aim to be a middle tier of analytics to help bridge that gap between metrics and log traces. They provide structured and standardized information that can be easily queried and analyzed, allowing for ad-hoc investigations into system behavior.
Canonical Log Lines
Canonical log lines are one single log line that captures information about one request that has reached the system. It includes information like:
- HTTP Method, Path
- Request Body (if any) – In our case, the request body is masked
- Headers received and Headers sent back in the response
- User Agent
- Rate Limit (Used and Remaining)
- Content-Type
- Request-Id
Here is an example (It’s a single string, line breaks are added intentionally in this article to understand things better):

✨By adding similar log structures in the downstream services, issue detection in the entire flow can be part of a few log lines (one log line per downstream service per request). This reduces the time to detect and time to fix issues extensively.✨
Distributed Tracing vs Canonical Logs
Tracing is a mechanism used to profile and monitor applications. Distributed Tracing tracks a single request through all its journey from its source to its destination. With the help of libraries, traces can be enabled in the system and it tracks the journey of a request by adding a trace_id to it. These libraries are mostly built with the OpenTelemetry standards, which is designed to provide developers with a standardised way to collect and export telemetry data from their applications. The trace_id is passed to downstream services. The library adds all the metadata required to visualise the data. Tracing can be used for real-time analytics (in case the system is throwing a 500). At Cashfree Payments, we have integrated grafana in conjunction with prometheus and datadog as our observability platform.
Canonical logs are more verbose, the structure of the log can differ from service to service and contain different sets of information than just traces. It contains raw log information (requests and responses) as well. Their implementation can differ from service to service based on the requirement. The logs are passed through a data collector stored and queried to derive multiple analytics data. They can also be used to trace the journey of a request provided that the logs are implemented in the downstream services and the log_id in the logs is the same. Canonical logs can be implemented when different analytics can be derived from data over a period of time.
Implementation
Middleware is the best place to implement these canonical log lines. The middleware captures the request and response payload and hence was the right place for us to host this implementation. This middleware further calls the registered Handler Function where all our logic resides. Finally, the log is emitted.
Storing Canonical Logs
We will not go in-depth about the storage process. On a very high level, the log lines that are emitted from the service, have to be stored somewhere, where it can be fetched by querying. At Cashfree Payments, we use our in-house Datalake developed using S3 and Apache Hudi to store these loglines. Logs from the services are collected, transformed and passed to Datalake using FluentD. Along the way, all these logs are also processed using Spark.
Why did we choose Datalake for Canonical Log storage?
- Data can be fetched with SQL – simple, widely used, and powerful.
- Queries are efficient when queried with the right partition columns
- Scalability – Large amounts of data can be stored and queried seamlessly.
- Low Cost – Compared to Kibana, data can be stored for longer periods, say 180 days, and can be queried for analytics purposes as well. Historical Data Analysis indeed plays a vital role.
Example Query, worth looking at 🔥
- Let’s say a merchant is making HTTP requests to create an order in Cashfree Payments (/pg/orders API ). Now we want to know all the errors (non 200s) that the merchant is facing. This can be achieved by SQL queries on data using AWS Athena.
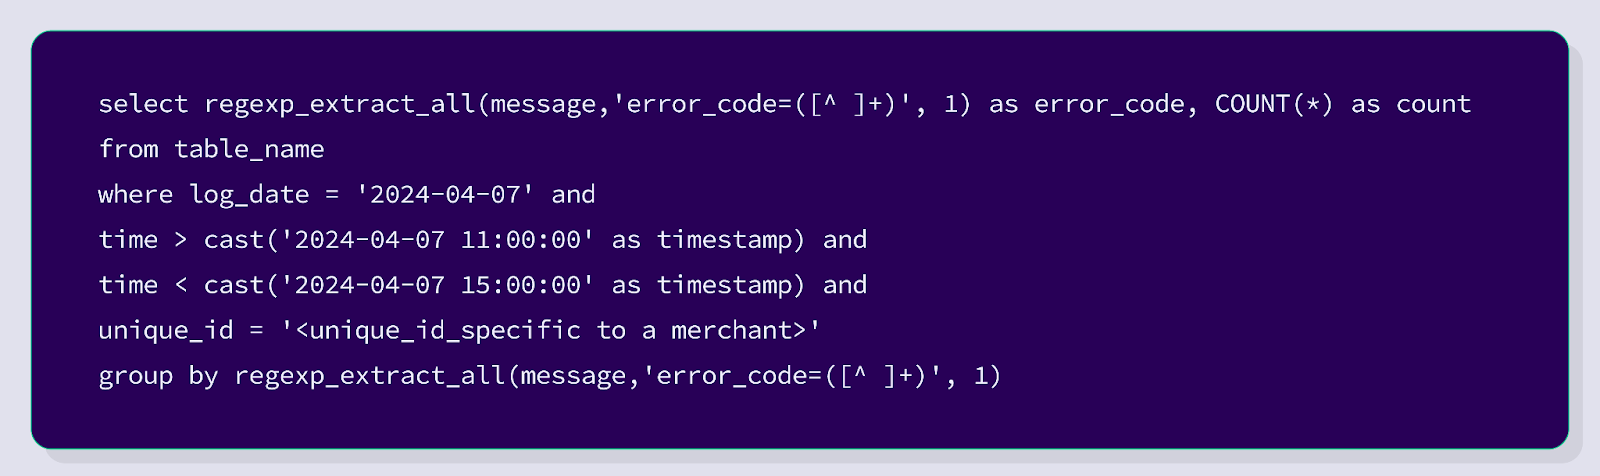

The above image is the response from the SQL query. This shows all the errors that were thrown by Cashfree Payments for the requests made by a particular merchant.
The query can be extended to retrieve data based on the user-agent, TLS version used, the most common errors by all merchants. The log lines are also used internally by teams for quick query resolutions / debugging. Using the trace_id present in the logline in the visualisation software gives a list of all the logs for a particular request. The analytics data that can be derived from this is mammoth.
Debugging with Canonical Log Lines
Utilizing the power of SQL to its full potential, we can query the log lines to fetch data and run analytics. For instance, we can get the count of errors by an API that the merchants hit. We can also get the count of errors by error_code. Internally we use this data for visualization and further check filtered logs with ease.
The above user interface shows a visualization of error counts by the API and error counts by error_code. This user interface is used by the teams internally to get quick insights.


The single log line is split and broken down into request, response, headers and displayed on the user interface. Since the log line contains a trace_id, we utilise that to open the visualisation platform for further analysis.
Extending the Canonical Log Lines to Merchants
If you cannot measure it, you cannot improve it.
Insights on API requests and responses play a major role when trying to improve API health.
When things are working exactly as expected (status codes being 200s), we are often not worried about it because that is what we strive to achieve. But more often than not, things break, it can be as simple as a phone number not being sent as a numerical value or having more than 10 digits. All cases where the status codes are non-200s are stored as canonical log lines and are shown to the merchants, which will help teams debug faster and fix the issues quickly.
To help merchants identify such issues quickly, all the errors, error codes, and error messages by API end-points are displayed on the dashboard. Along with this, it also contains the request sent, the response triggered, all the headers, and more.


- The above screenshot shows order_expiry value being in an incorrect format.
- It also indicates that there have been 9 failures in the ‘create order’ API and 5 failures in the ‘create link’ API in the last 4 hours.
- This will help merchants identify the issue at the earliest.
- These log structures are also used internally for multiple purposes
- The gateway layer adopts the same log structure to capture authentication errors and rate limit breaches.
- It is used by the support team to provide quick resolutions.
- It is also used by the developers and product managers for debugging.
What’s Next
While this helps the merchants get more insight into the non-200s in their integration with Cashfree Payments, we are continuously striving to provide the best developer experience out there in the industry. Stay tuned for more exciting blogs coming your way.


