> ## Documentation Index
> Fetch the complete documentation index at: https://www.cashfree.com/docs/llms.txt
> Use this file to discover all available pages before exploring further.
# Payment Analytics
> Use Cashfree Payments Intelligence to optimise checkout, find conversion drop-offs, reduce costs, and surface patterns that grow online sales for your store.
Payments Intelligence helps you optimise payments, boost sales, and reduce costs. Discover patterns, fix issues, and enhance customer experience to drive growth.
You can access analytics in the **[Merchant Dashboard](https://merchant.cashfree.com/auth/login)** and go to **Payment Gateway > Summary > Analytics**.
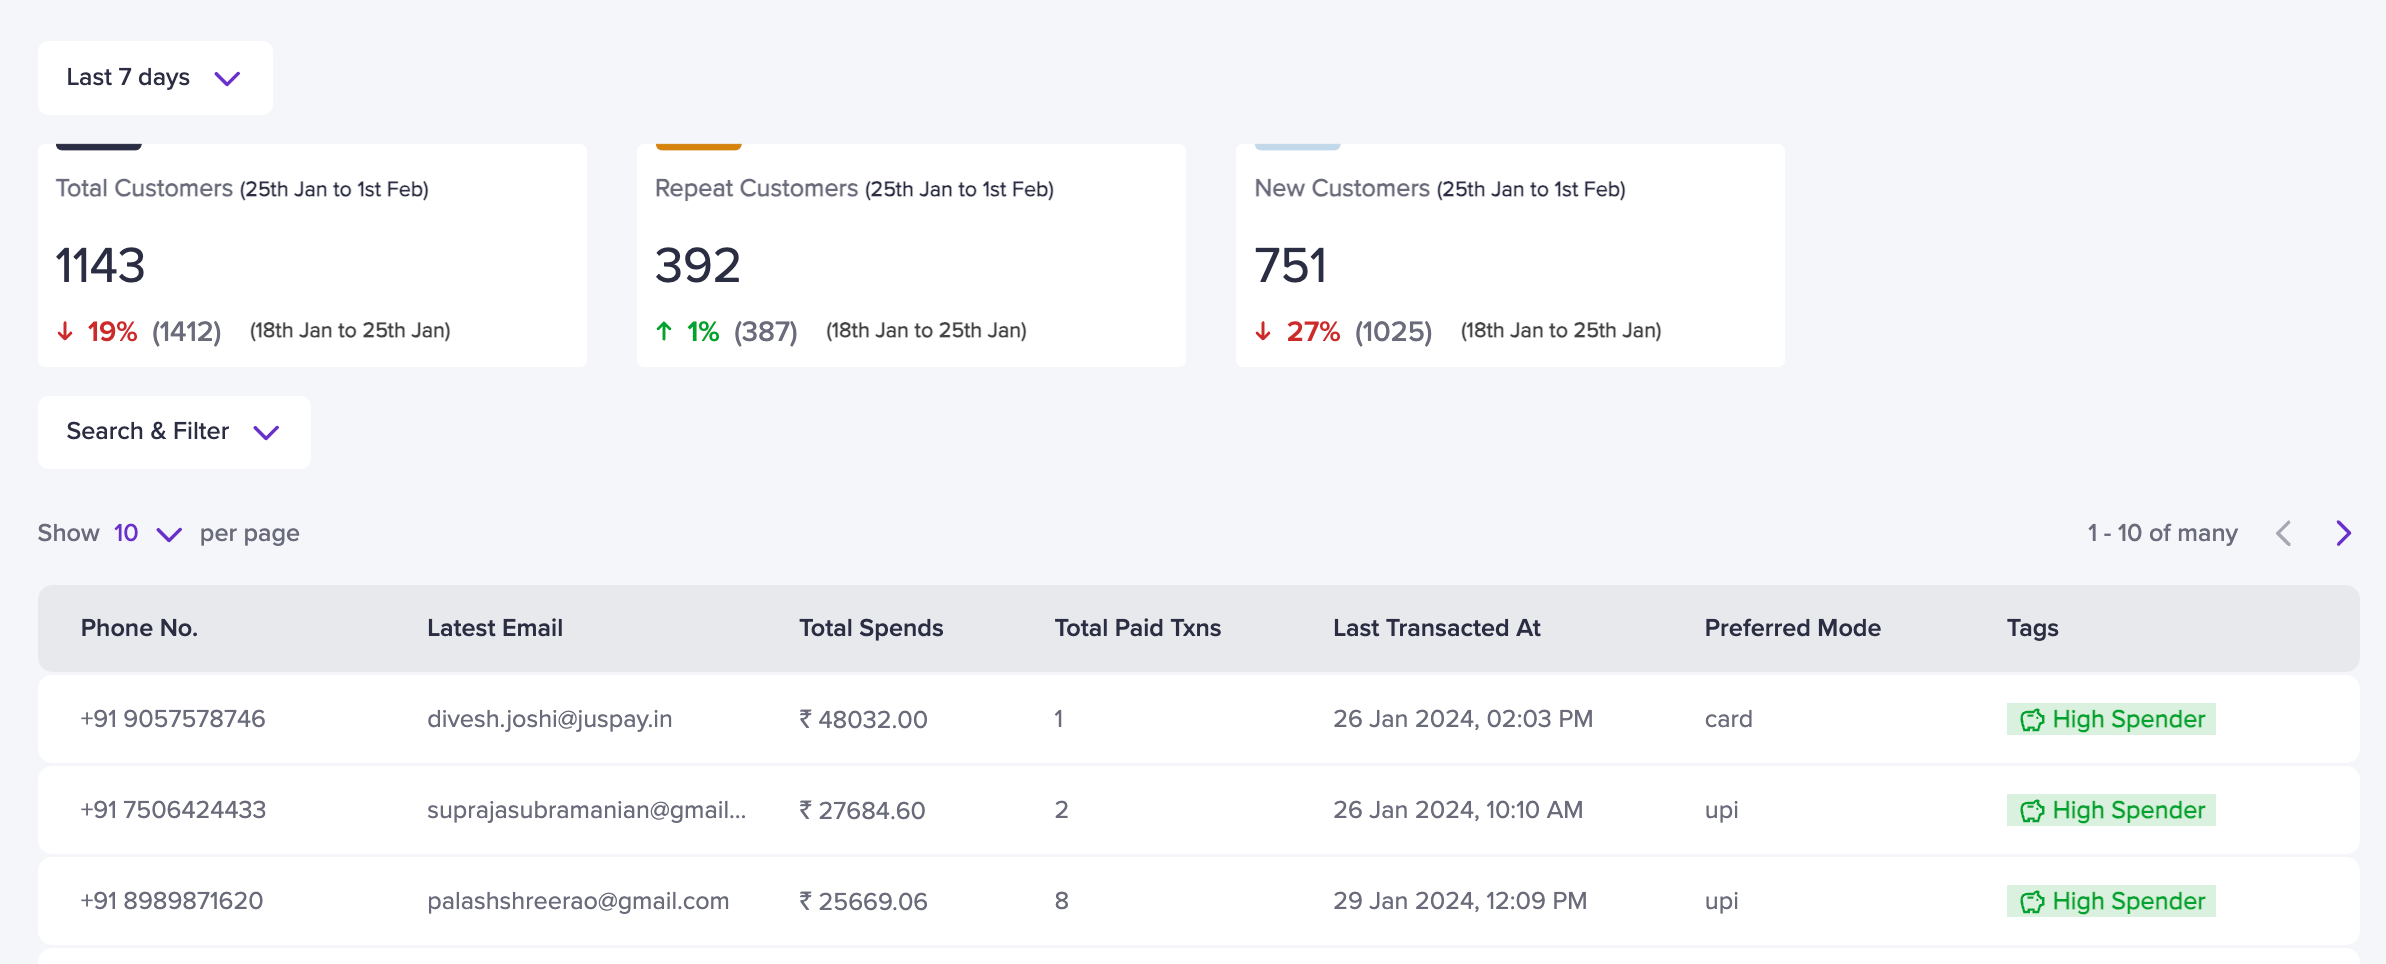
## Payment analytics
Payment analytics reveals buying patterns and key customer segments.
* **Customer journey insights**\
Track repeat and new customers’ buying behaviour to improve targeting.
 * **Identify high-value customers**\
Find loyal buyers and potential repeat customers to boost engagement.
* **Identify high-value customers**\
Find loyal buyers and potential repeat customers to boost engagement.
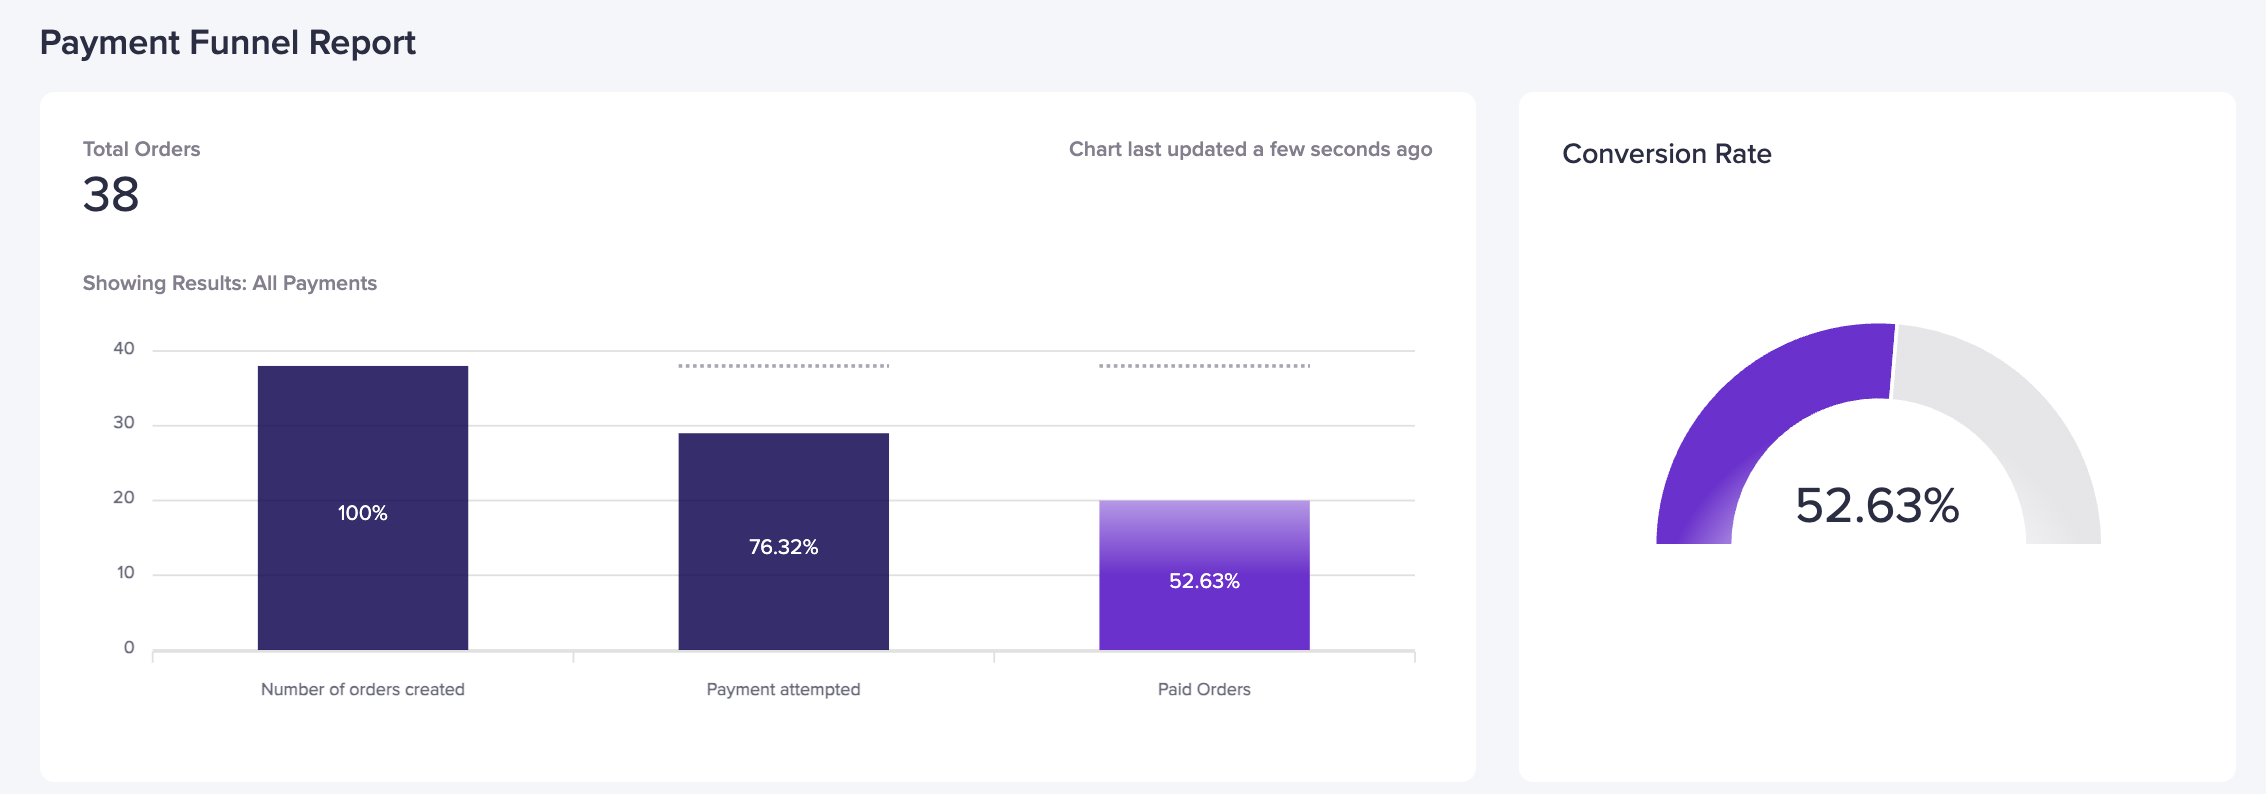
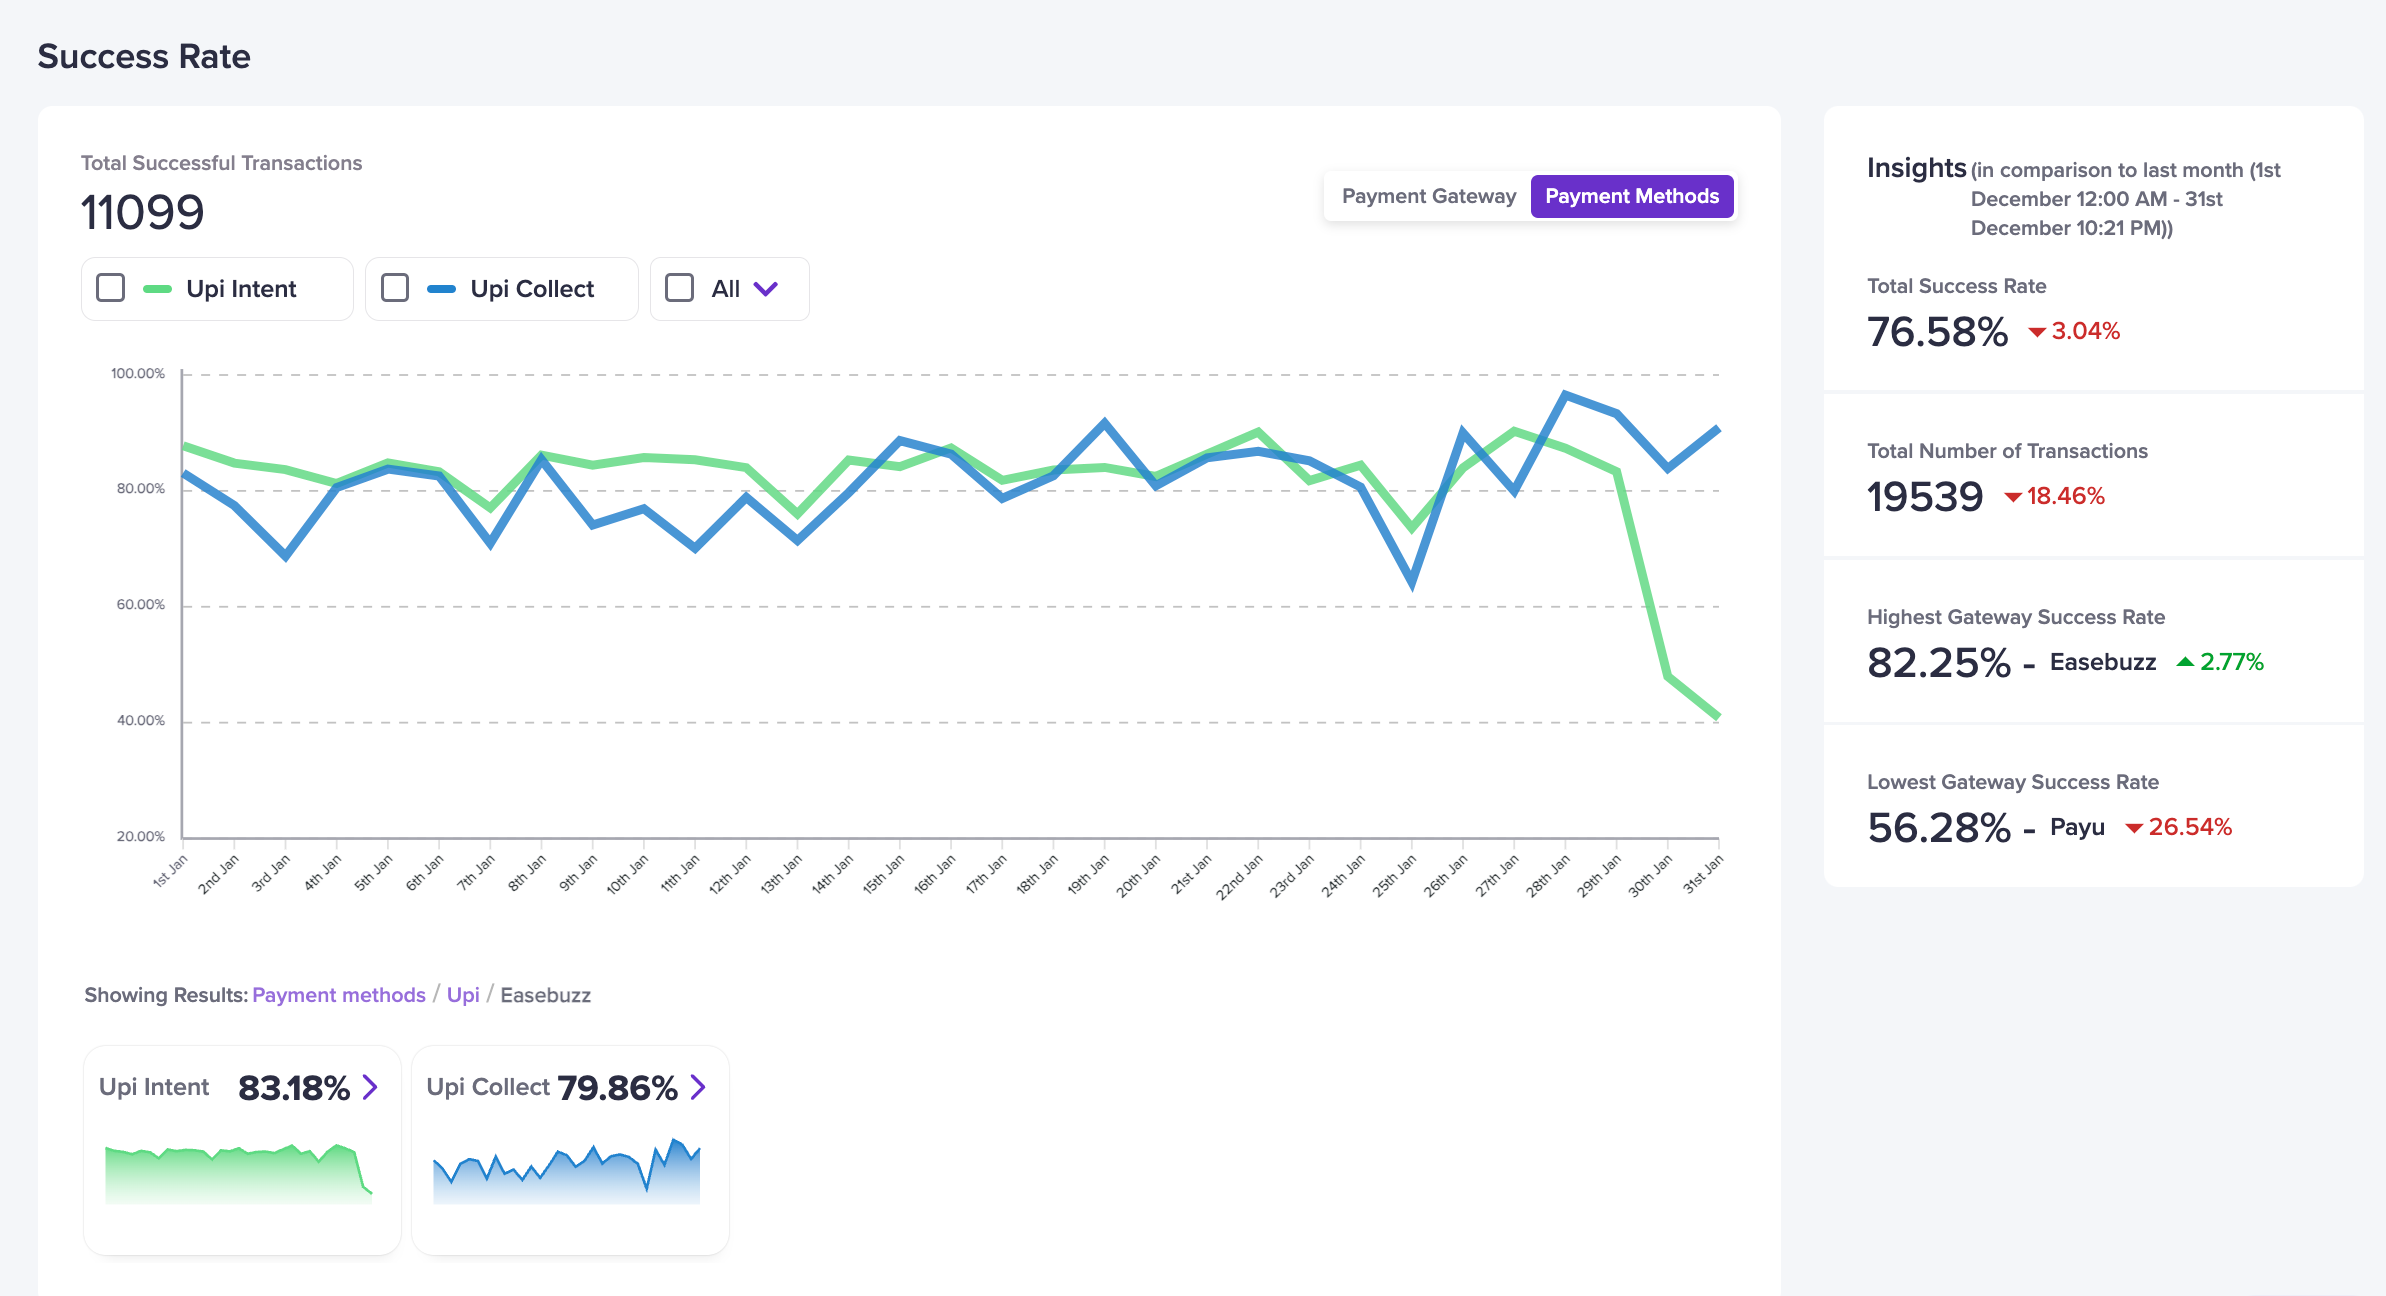
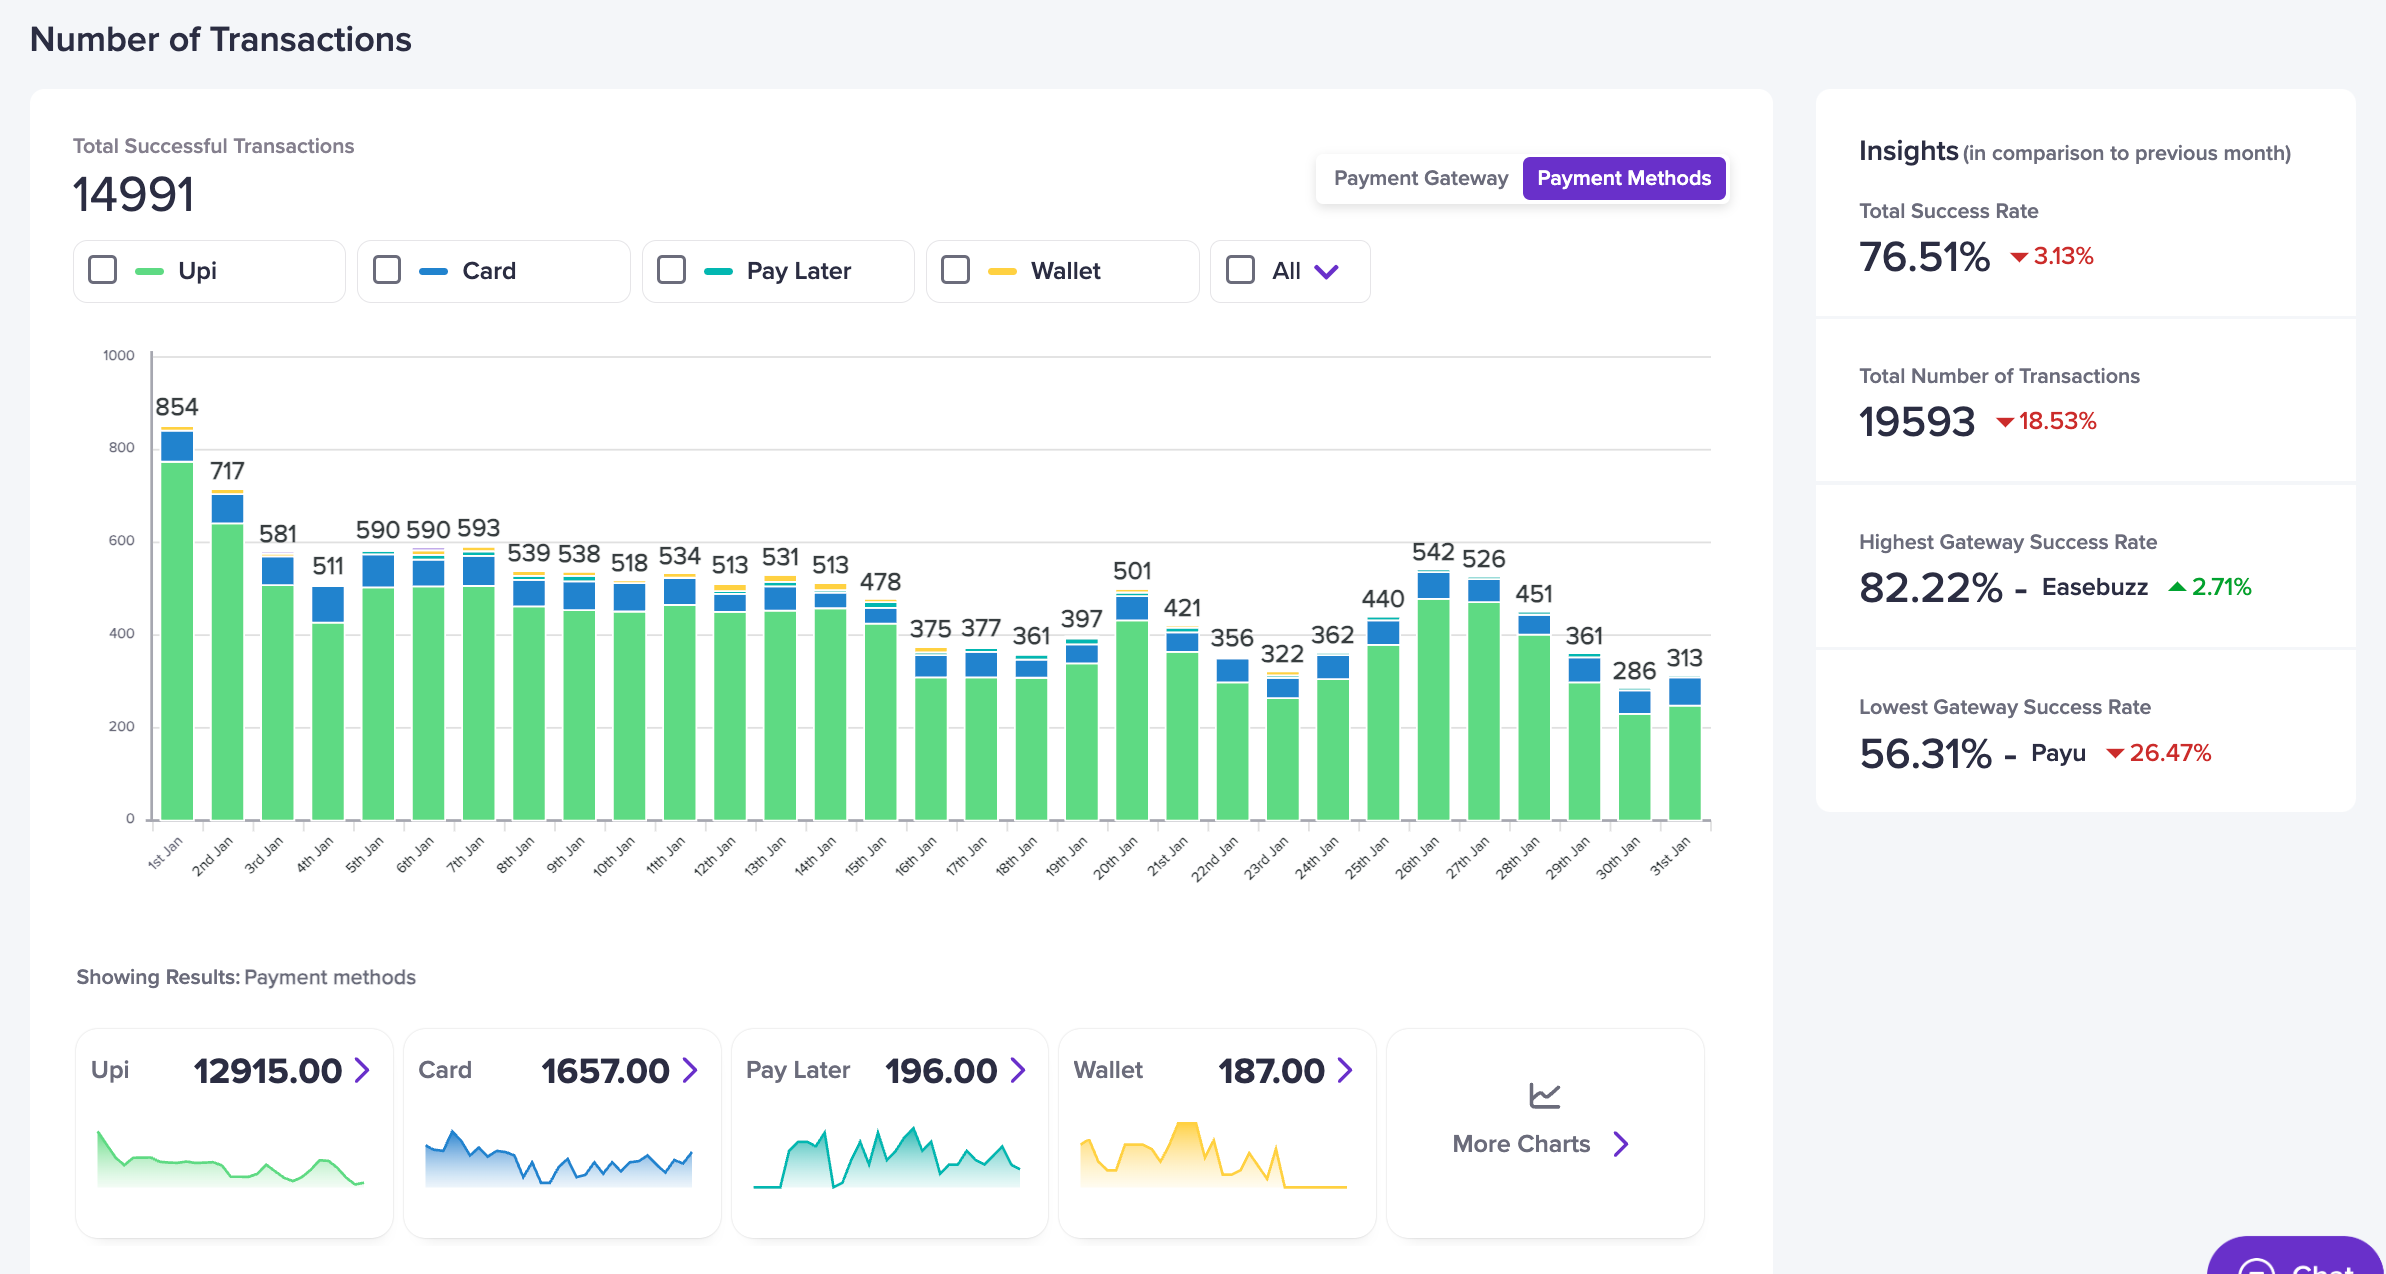
 ## Success rate analytics
Success rate shows the percentage of successful transactions. Tracking success rate helps you spot payment issues and create a smoother checkout.
### Transaction analytics
* **Monitor success rates by payment method**\
See which payment methods work best, for example UPI and card, and identify issues.
## Success rate analytics
Success rate shows the percentage of successful transactions. Tracking success rate helps you spot payment issues and create a smoother checkout.
### Transaction analytics
* **Monitor success rates by payment method**\
See which payment methods work best, for example UPI and card, and identify issues.
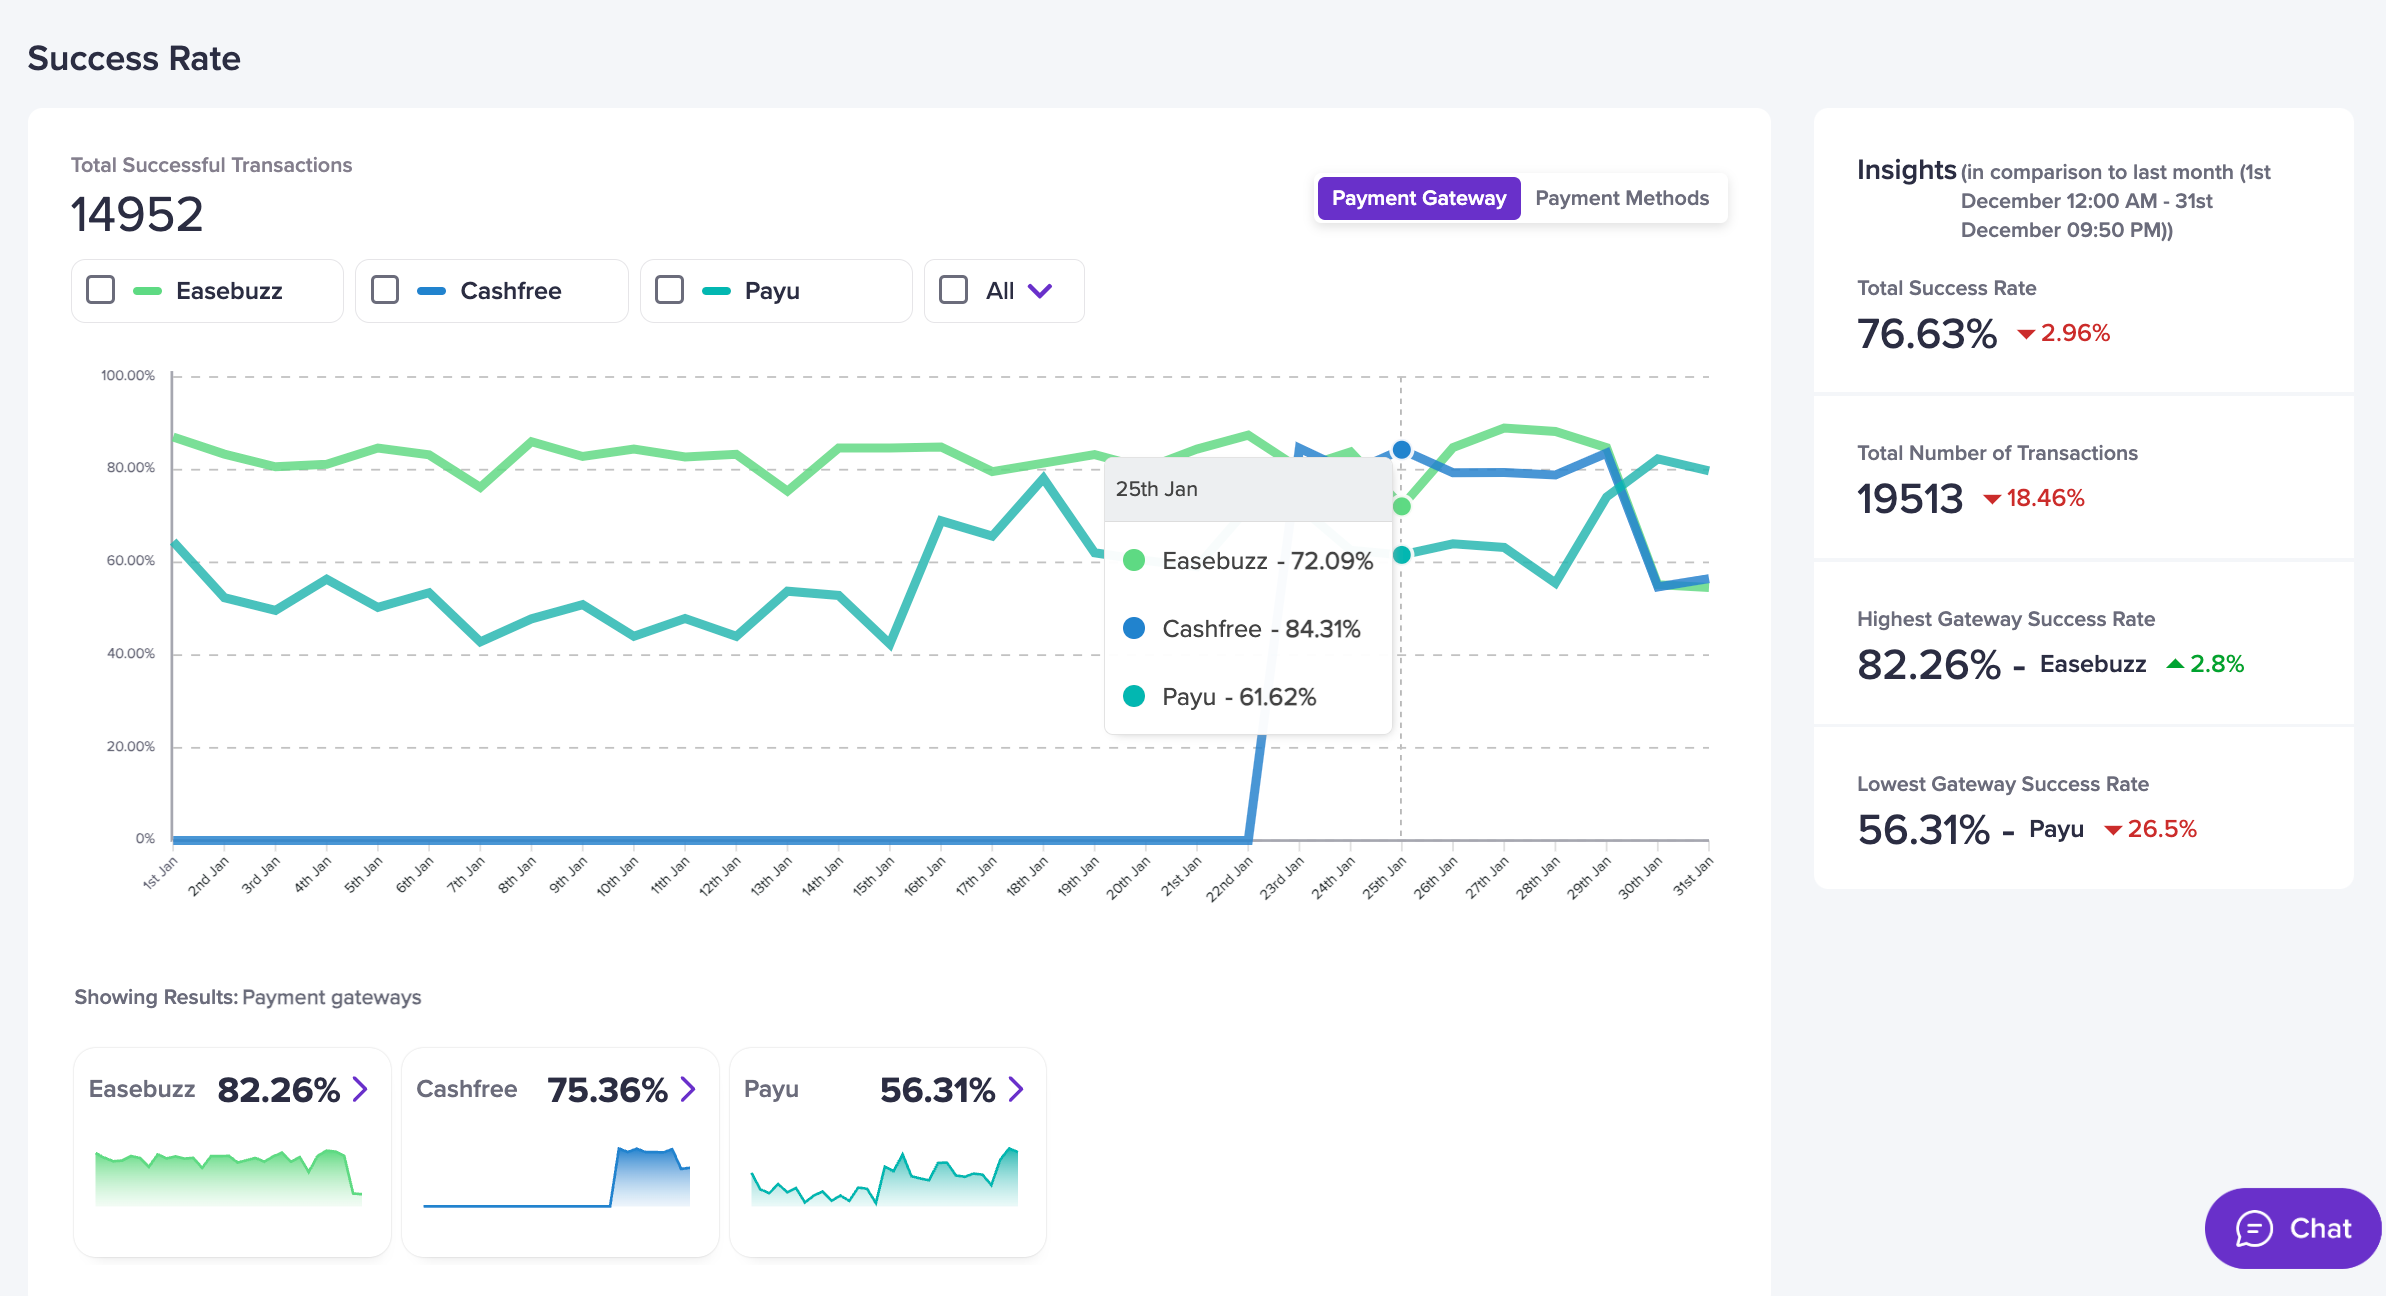 * **Detailed gateway and method insights**\
Check success rate by each gateway to understand and optimise your payment options.
* **Detailed gateway and method insights**\
Check success rate by each gateway to understand and optimise your payment options.
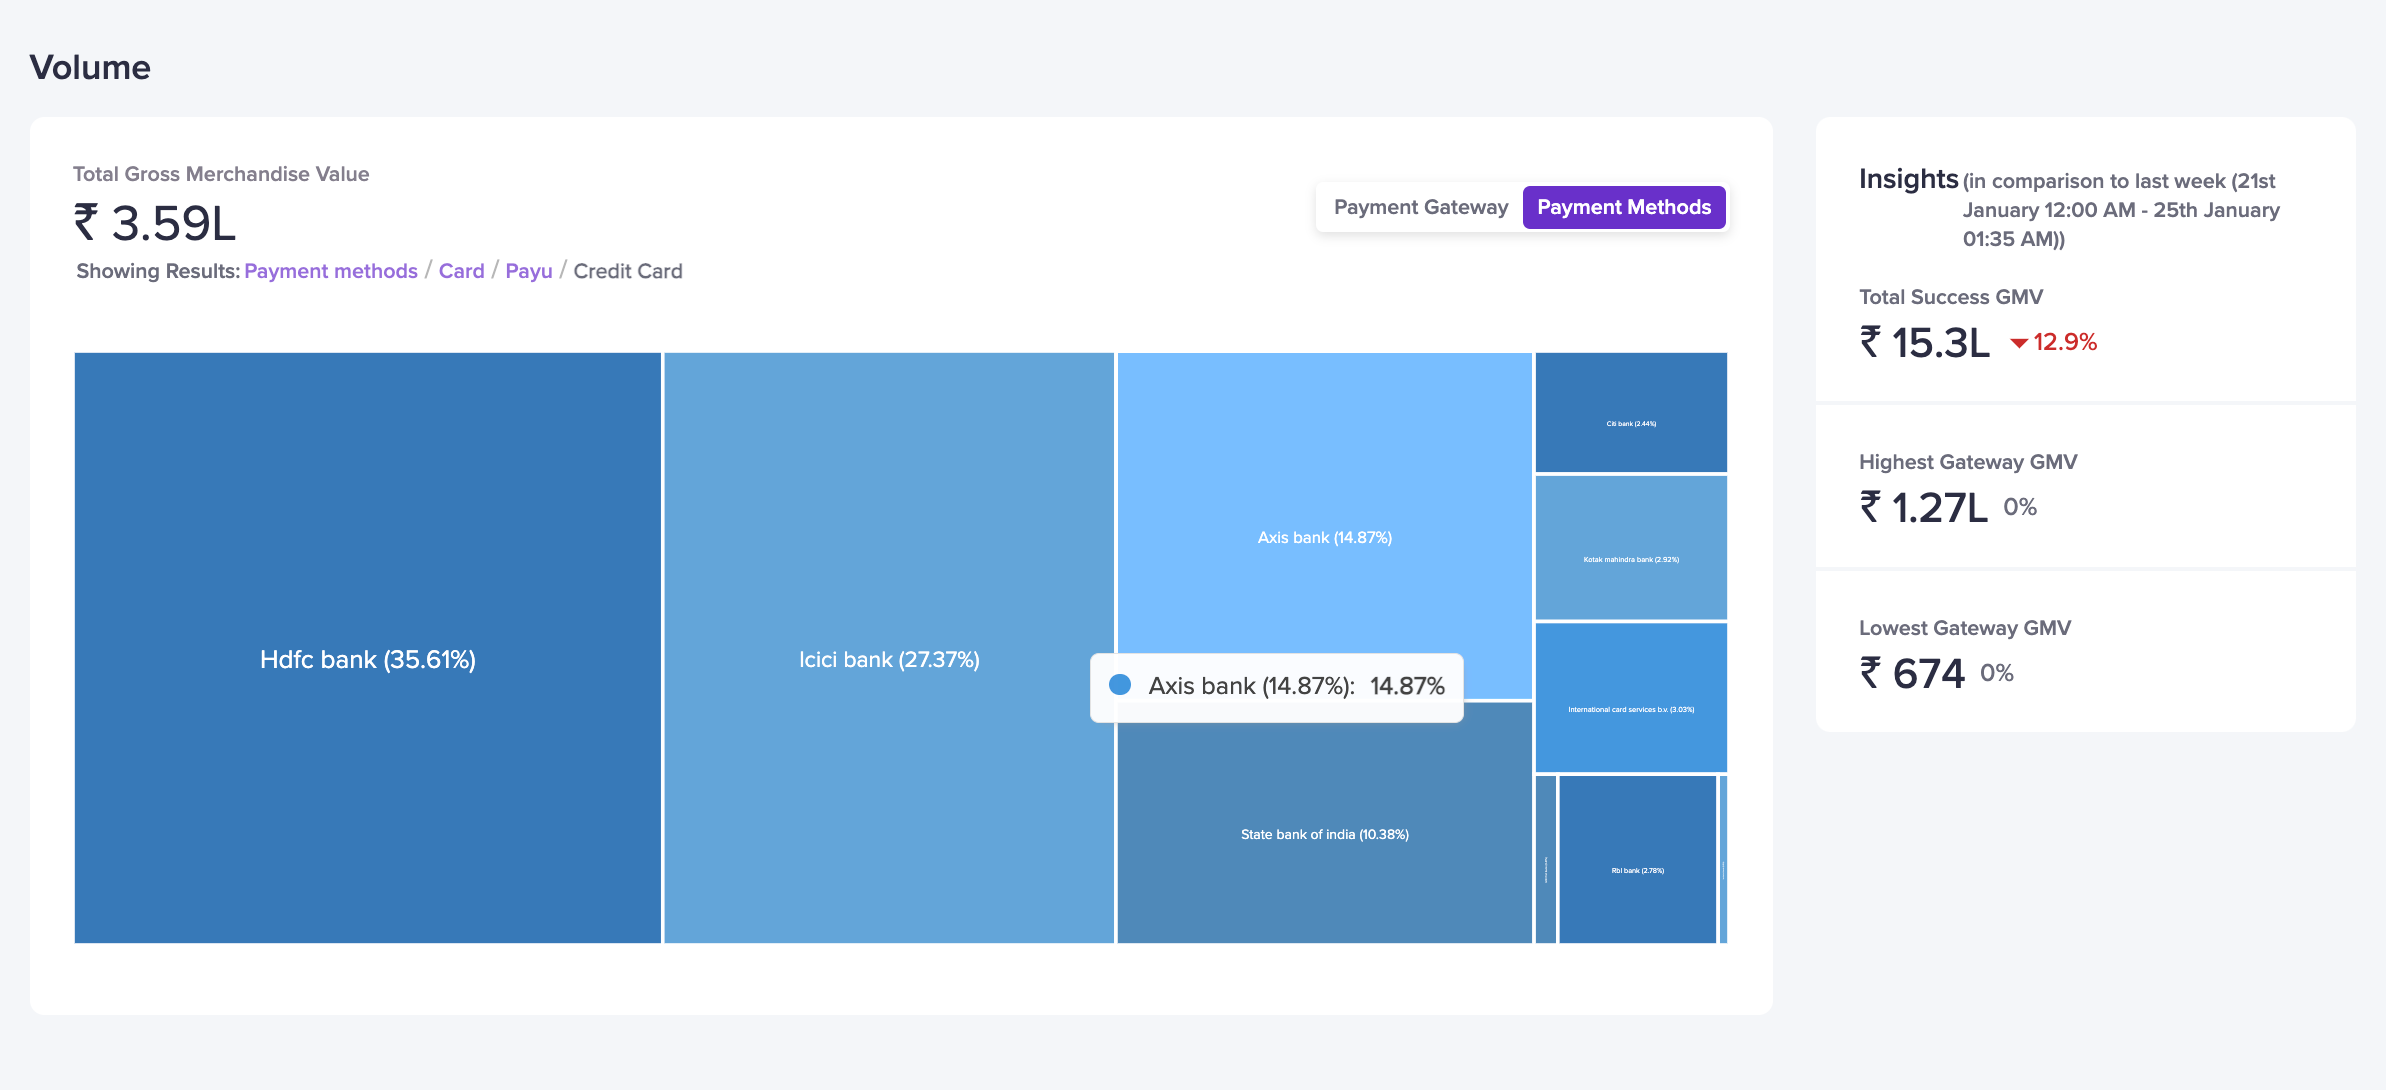
 ## Volume analytics
Volume analytics shows how much each payment method contributes to total sales.
* **View payment volume across methods**\
Understand which payment types your customers prefer, for example, UPI or wallet.
## Volume analytics
Volume analytics shows how much each payment method contributes to total sales.
* **View payment volume across methods**\
Understand which payment types your customers prefer, for example, UPI or wallet.
 * **Customer payment preferences**\
Use these insights to adjust payment options based on customer trends.
* **Customer payment preferences**\
Use these insights to adjust payment options based on customer trends.
 ## Regional insights
Regional insights provide visibility into where your customers are transacting from. The dashboard displays the successful transaction volumes segmented by states and regions, helping you track business performance geographically.
Locations are derived from IP addresses. These are estimates and may not always reflect the actual origin for server-to-server traffic.
* **Trend visualisation**: Track successful transactions over time across selected regions.
* **State and district level breakdown**: Within each state, you can drill down to view transaction volumes at the district or regional level.
* **Comparison view**: Select multiple states to compare transaction performance side by side.
## Regional insights
Regional insights provide visibility into where your customers are transacting from. The dashboard displays the successful transaction volumes segmented by states and regions, helping you track business performance geographically.
Locations are derived from IP addresses. These are estimates and may not always reflect the actual origin for server-to-server traffic.
* **Trend visualisation**: Track successful transactions over time across selected regions.
* **State and district level breakdown**: Within each state, you can drill down to view transaction volumes at the district or regional level.
* **Comparison view**: Select multiple states to compare transaction performance side by side.
 **Example**\
In the example shown above, Maharashtra contributed the highest transaction volume with 13,741 successful transactions. Delhi, Gujarat, Uttar Pradesh, and West Bengal each recorded five successful transactions, while Karnataka recorded four successful transactions during the same period.
Use these insights to identify high-performing regions, optimise marketing spend, and understand customer behaviour across geographies.
snippets/related-topics-loader.mdx
**Example**\
In the example shown above, Maharashtra contributed the highest transaction volume with 13,741 successful transactions. Delhi, Gujarat, Uttar Pradesh, and West Bengal each recorded five successful transactions, while Karnataka recorded four successful transactions during the same period.
Use these insights to identify high-performing regions, optimise marketing spend, and understand customer behaviour across geographies.
snippets/related-topics-loader.mdx