Risk score summary
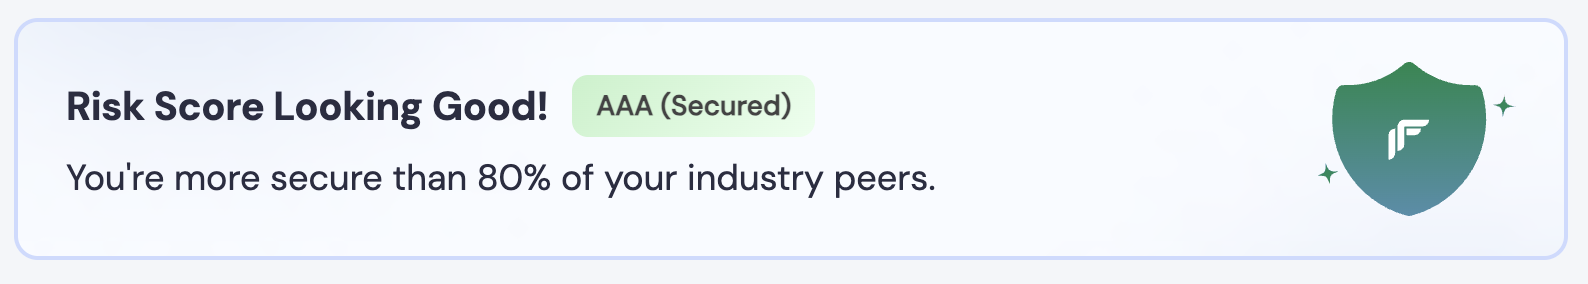
A higher score (AAA/AA) reflects a strong fraud posture with low dispute risk, while lower scores (BBB/BB) indicate increased exposure and the need for closer monitoring.
Dispute ratio
Dispute to Sales Ratio is the total disputed amount (fraud + service) reported in a given time, divided by the total sales (GMV) processed in that time. Dispute to Sales Ratio = Total disputed amount / Total sales (GMV). You can toggle between Dispute to Sales Ratio and Fraud to Sales Ratio to compare against Total Sales (GMV) over Daily, Weekly, or Monthly periods.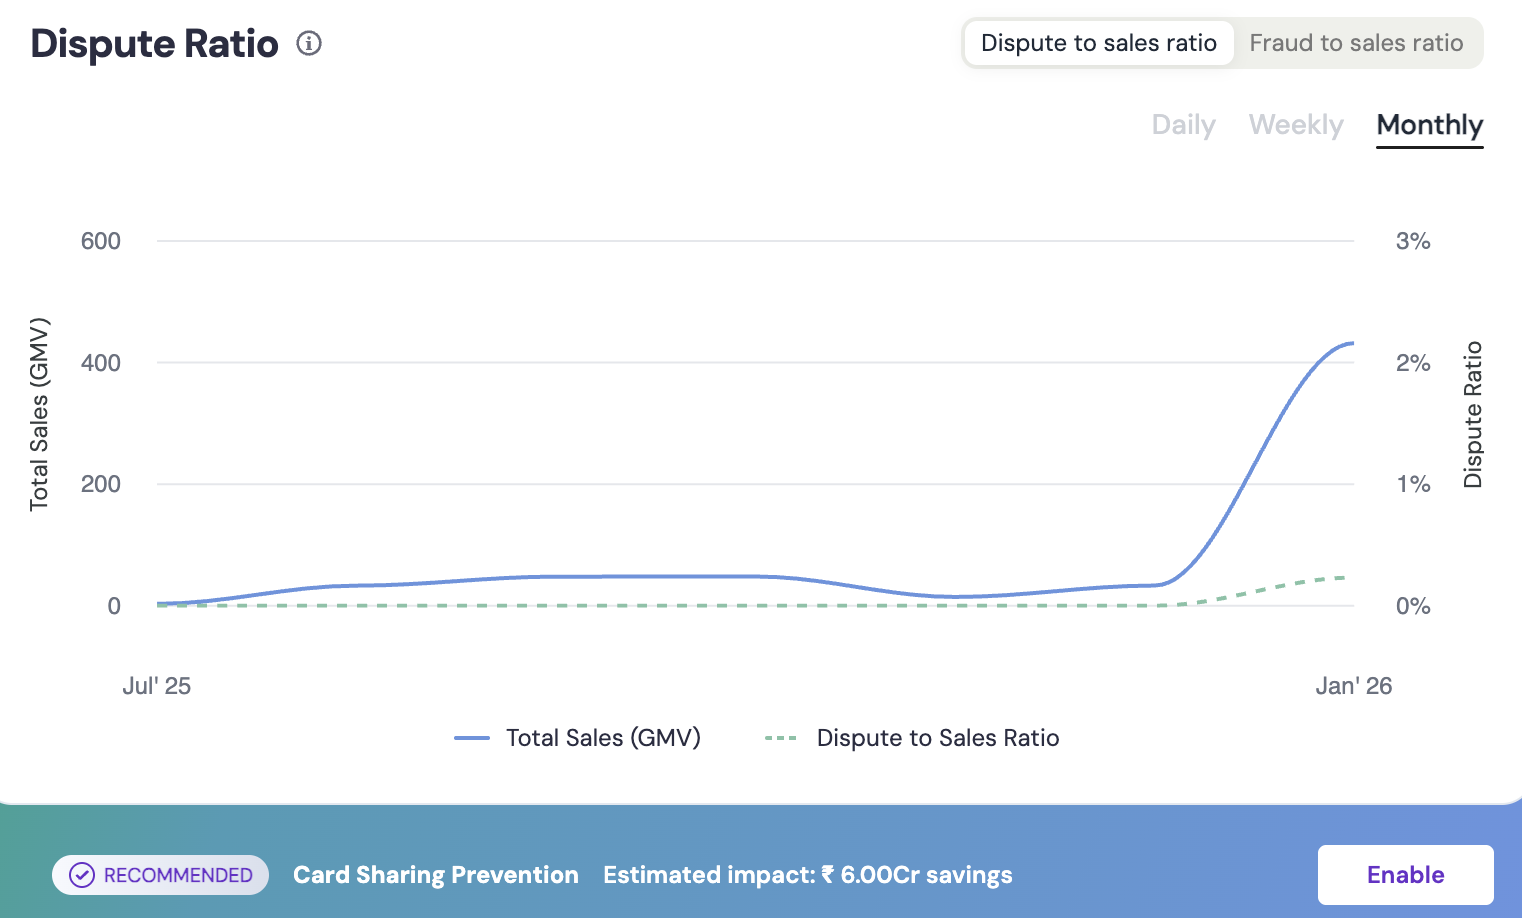
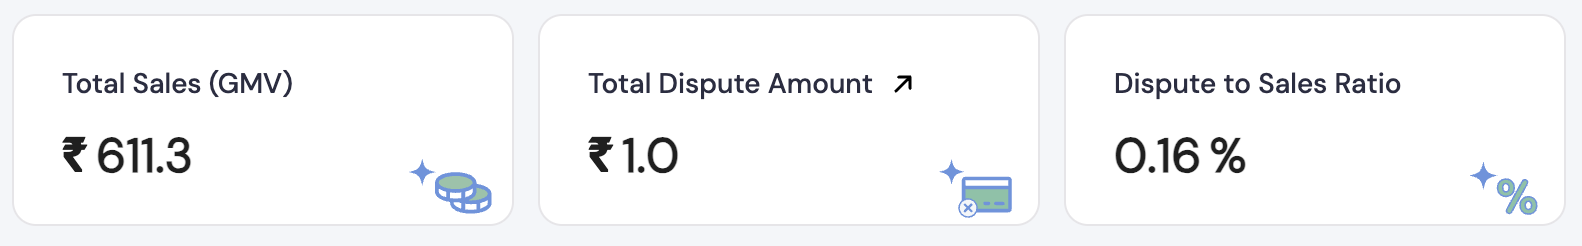
Top metrics
This section gives you a quick snapshot of your key fraud and sales performance metrics for the selected time period. The following metrics showcased are:- Total Sales (GMV) : Total successful transaction volume.
- Total Dispute Amount : Value of all disputes reported in the selected duration.
- Dispute to Sales Ratio : Percentage of sales turning into disputes.
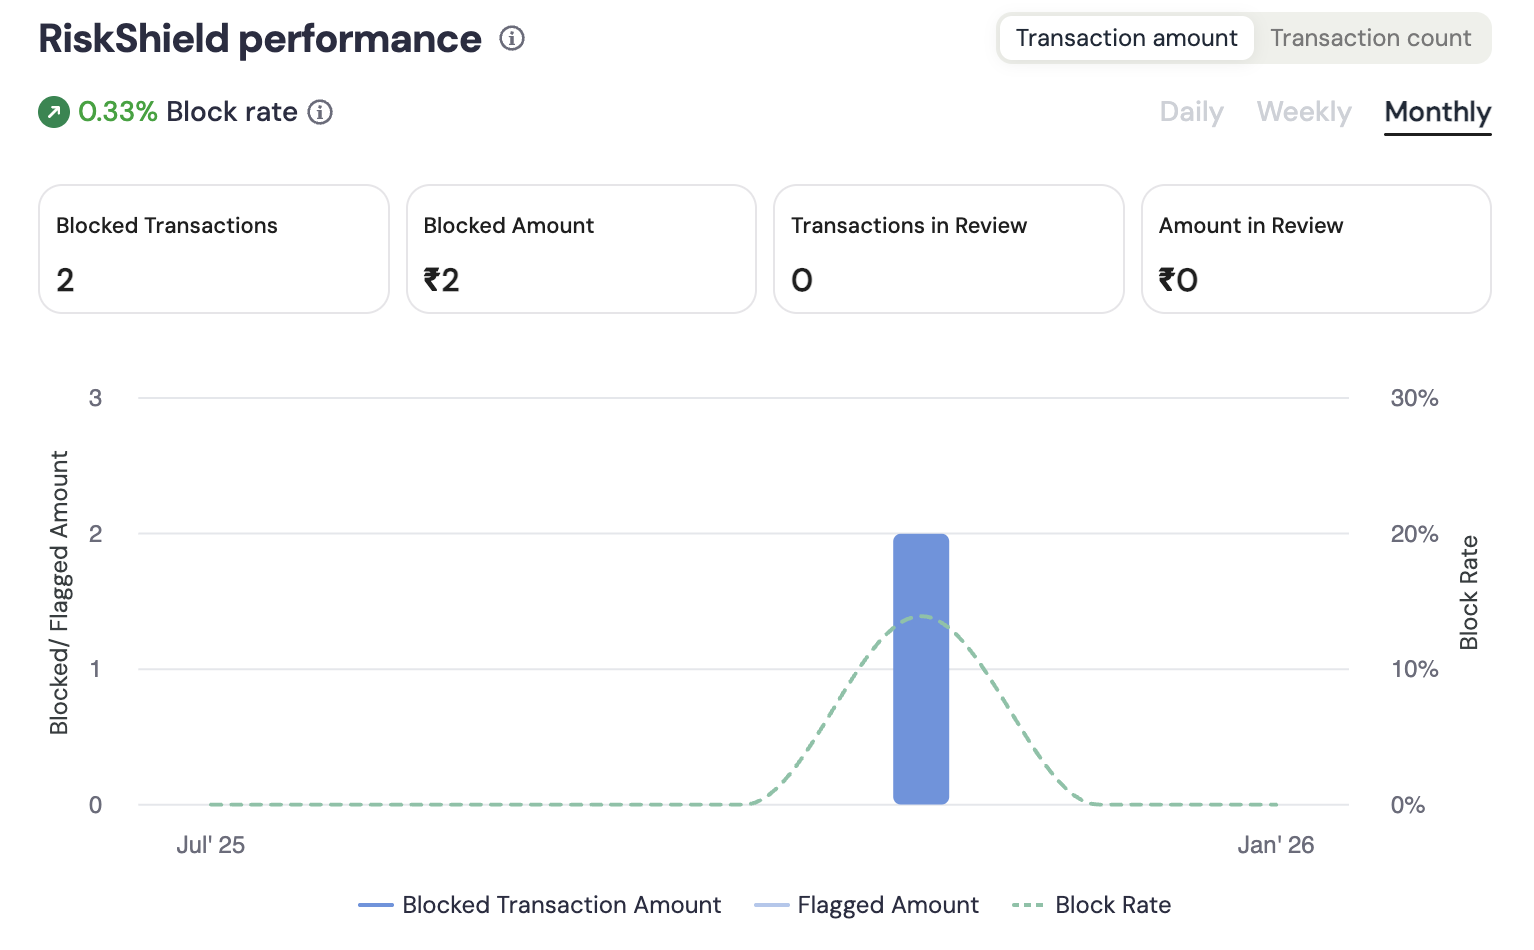
RiskShield performance
This section gives you a detailed breakdown of how RiskShield is protecting your business. You can monitor the following metrics:- Blocked Transactions: Count of transactions blocked by RiskShield.
- Blocked Amount: Value of fraudulent attempts prevented.
- Transactions in Review: Transactions flagged for manual review.
- Amount in Review: Value of transactions under review.
Fraud hotspots
Monitor where fraud originates to identify the top states and cities contributing to fraud volume. You can toggle between States and Cities to view specific fraud sources. For example, 100% of your frauds are from Karnataka. These insights help you identify geographical risk clusters and take actions such as tightening rules or reviewing suspicious locations.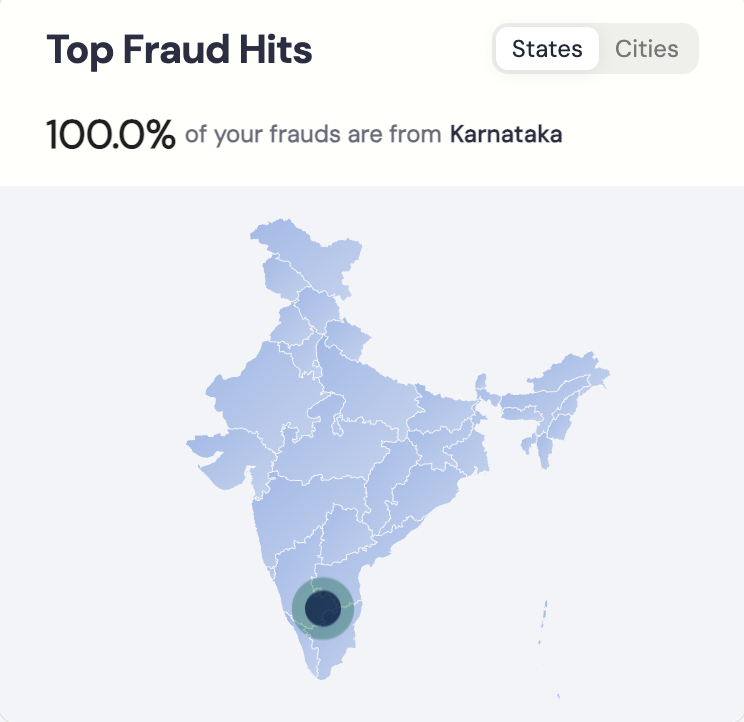
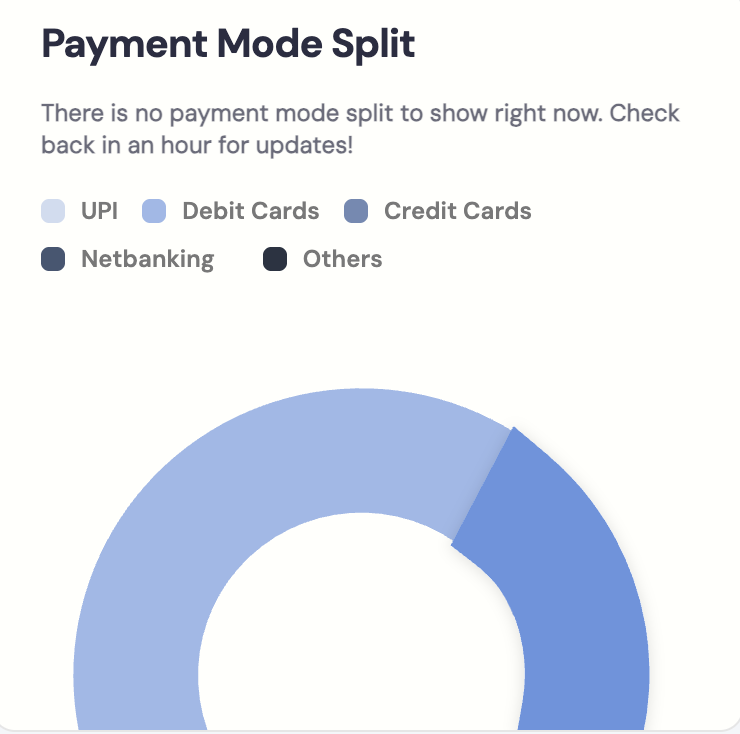
Payment mode split
Identify which payment methods contribute most to your disputes or fraudulent transactions. The split may include:- UPI
- Debit cards
- Credit cards
- Netbanking
- Wallets
- Other methods
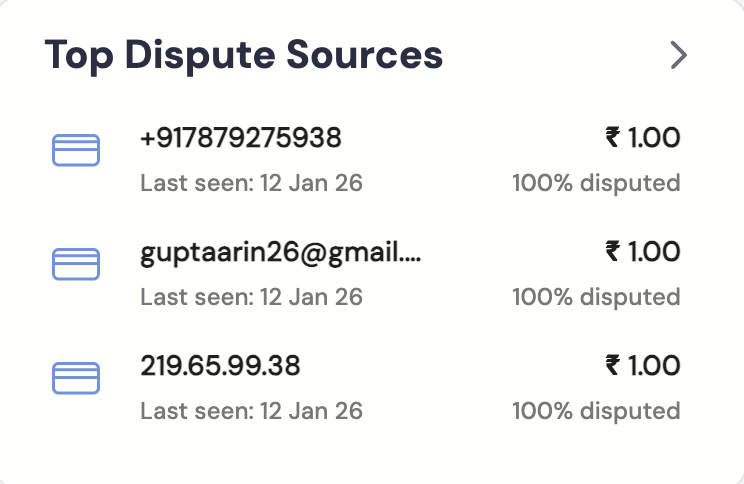
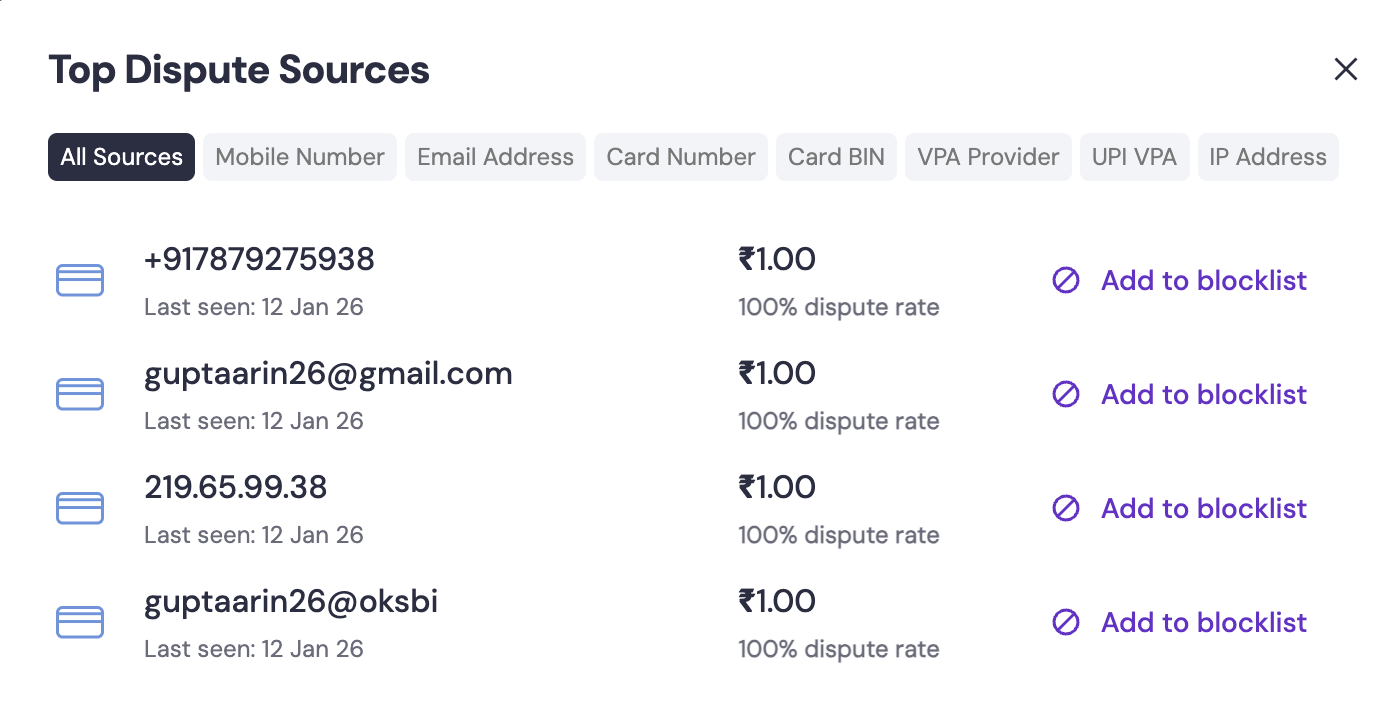
Top dispute sources
This section lists the most frequent origins of disputes so you can identify repeat offenders and take preventive action. RiskShield tracks disputes across multiple source types to help you pinpoint patterns:-
Identity and contact sources
- IP address: Track disputes originating from specific IP addresses.
- Phone number: Monitor phone numbers linked to disputed transactions.
- Email address: Identify email addresses associated with fraudulent activity.
-
Payment sources
- UPI ID or VPA: Track disputes from specific UPI Virtual Payment Addresses.
- BIN or masked card details: Monitor card ranges (Bank Identification Numbers) with high dispute rates.
- Payment provider: Analyse dispute trends by payment gateway or provider.
-
Network sources
- IP type: Identify disputes from VPN, TOR, or Data Centre Hosting (DCH) networks.
- Disputed amount: Total value of disputes from this source.
- Percentage contribution: Percentage of your total disputes attributed to this source.
- Last seen: Most recent transaction from this source.
- Trend of disputes: Pattern showing whether disputes from this source are increasing or decreasing.
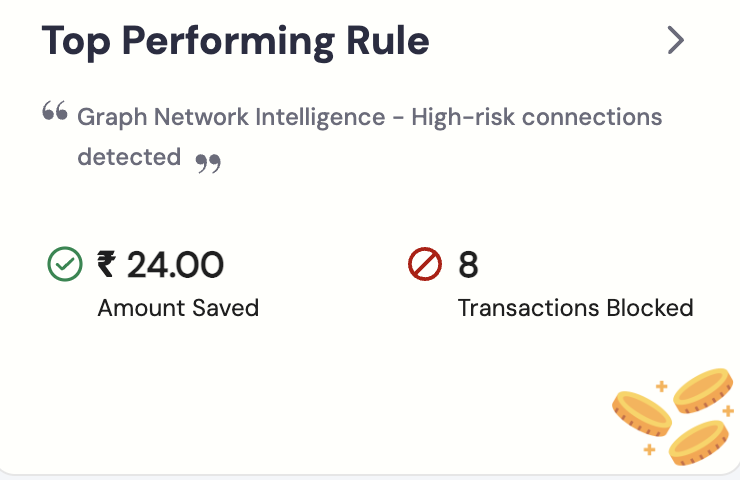
Rule performance
Track the effectiveness of your RiskShield rules in preventing fraud. This section showcases your Top Performing Rule, highlighting the specific rule name along with the total Amount Saved and the number of Transactions Blocked. For each rule, you can monitor:- Rule Name: The name of the fraud prevention rule.
- Blocked Transactions: Number of transactions blocked by this rule.
- Amount Saved: Total value of fraudulent transactions prevented.
- Date Added: When the rule was created or activated.