Add a webhook endpoint
To add a new webhook:- Log in to the Merchant Dashboard.
- Go to Payment Gateway > Developers or select Developers from the homepage.
- Select Add Webhook Endpoint to create a new webhook. Enter the endpoint URL and select the webhook version from the drop-down menu. The available webhook versions are 2022-09-01, 2023-08-01, and 2025-01-01.
- Select Test to verify if the webhook endpoint returns a response and select Next.
In the sandbox environment, both http:// and https:// endpoints are supported. In the production environment, only https:// endpoints are supported.
- Select the events for which you want to configure the webhooks and select Add Webhook.
View available webhook events
View available webhook events
- Dispute Closed
- Dispute Created
- Dispute Updated
- Failed Payment
- Incident
- Instrument Active
- Instrument Failed
- Refund
- Settlement Failed
- Settlement Initiated
- Settlement Reversed
- Success Payment
- Success Payment TDR
- User Dropped Payment
- Vendor Settlement Failed
- Vendor Settlement Initiated
- Vendor Settlement Reversed
- Vendor Settlement Success
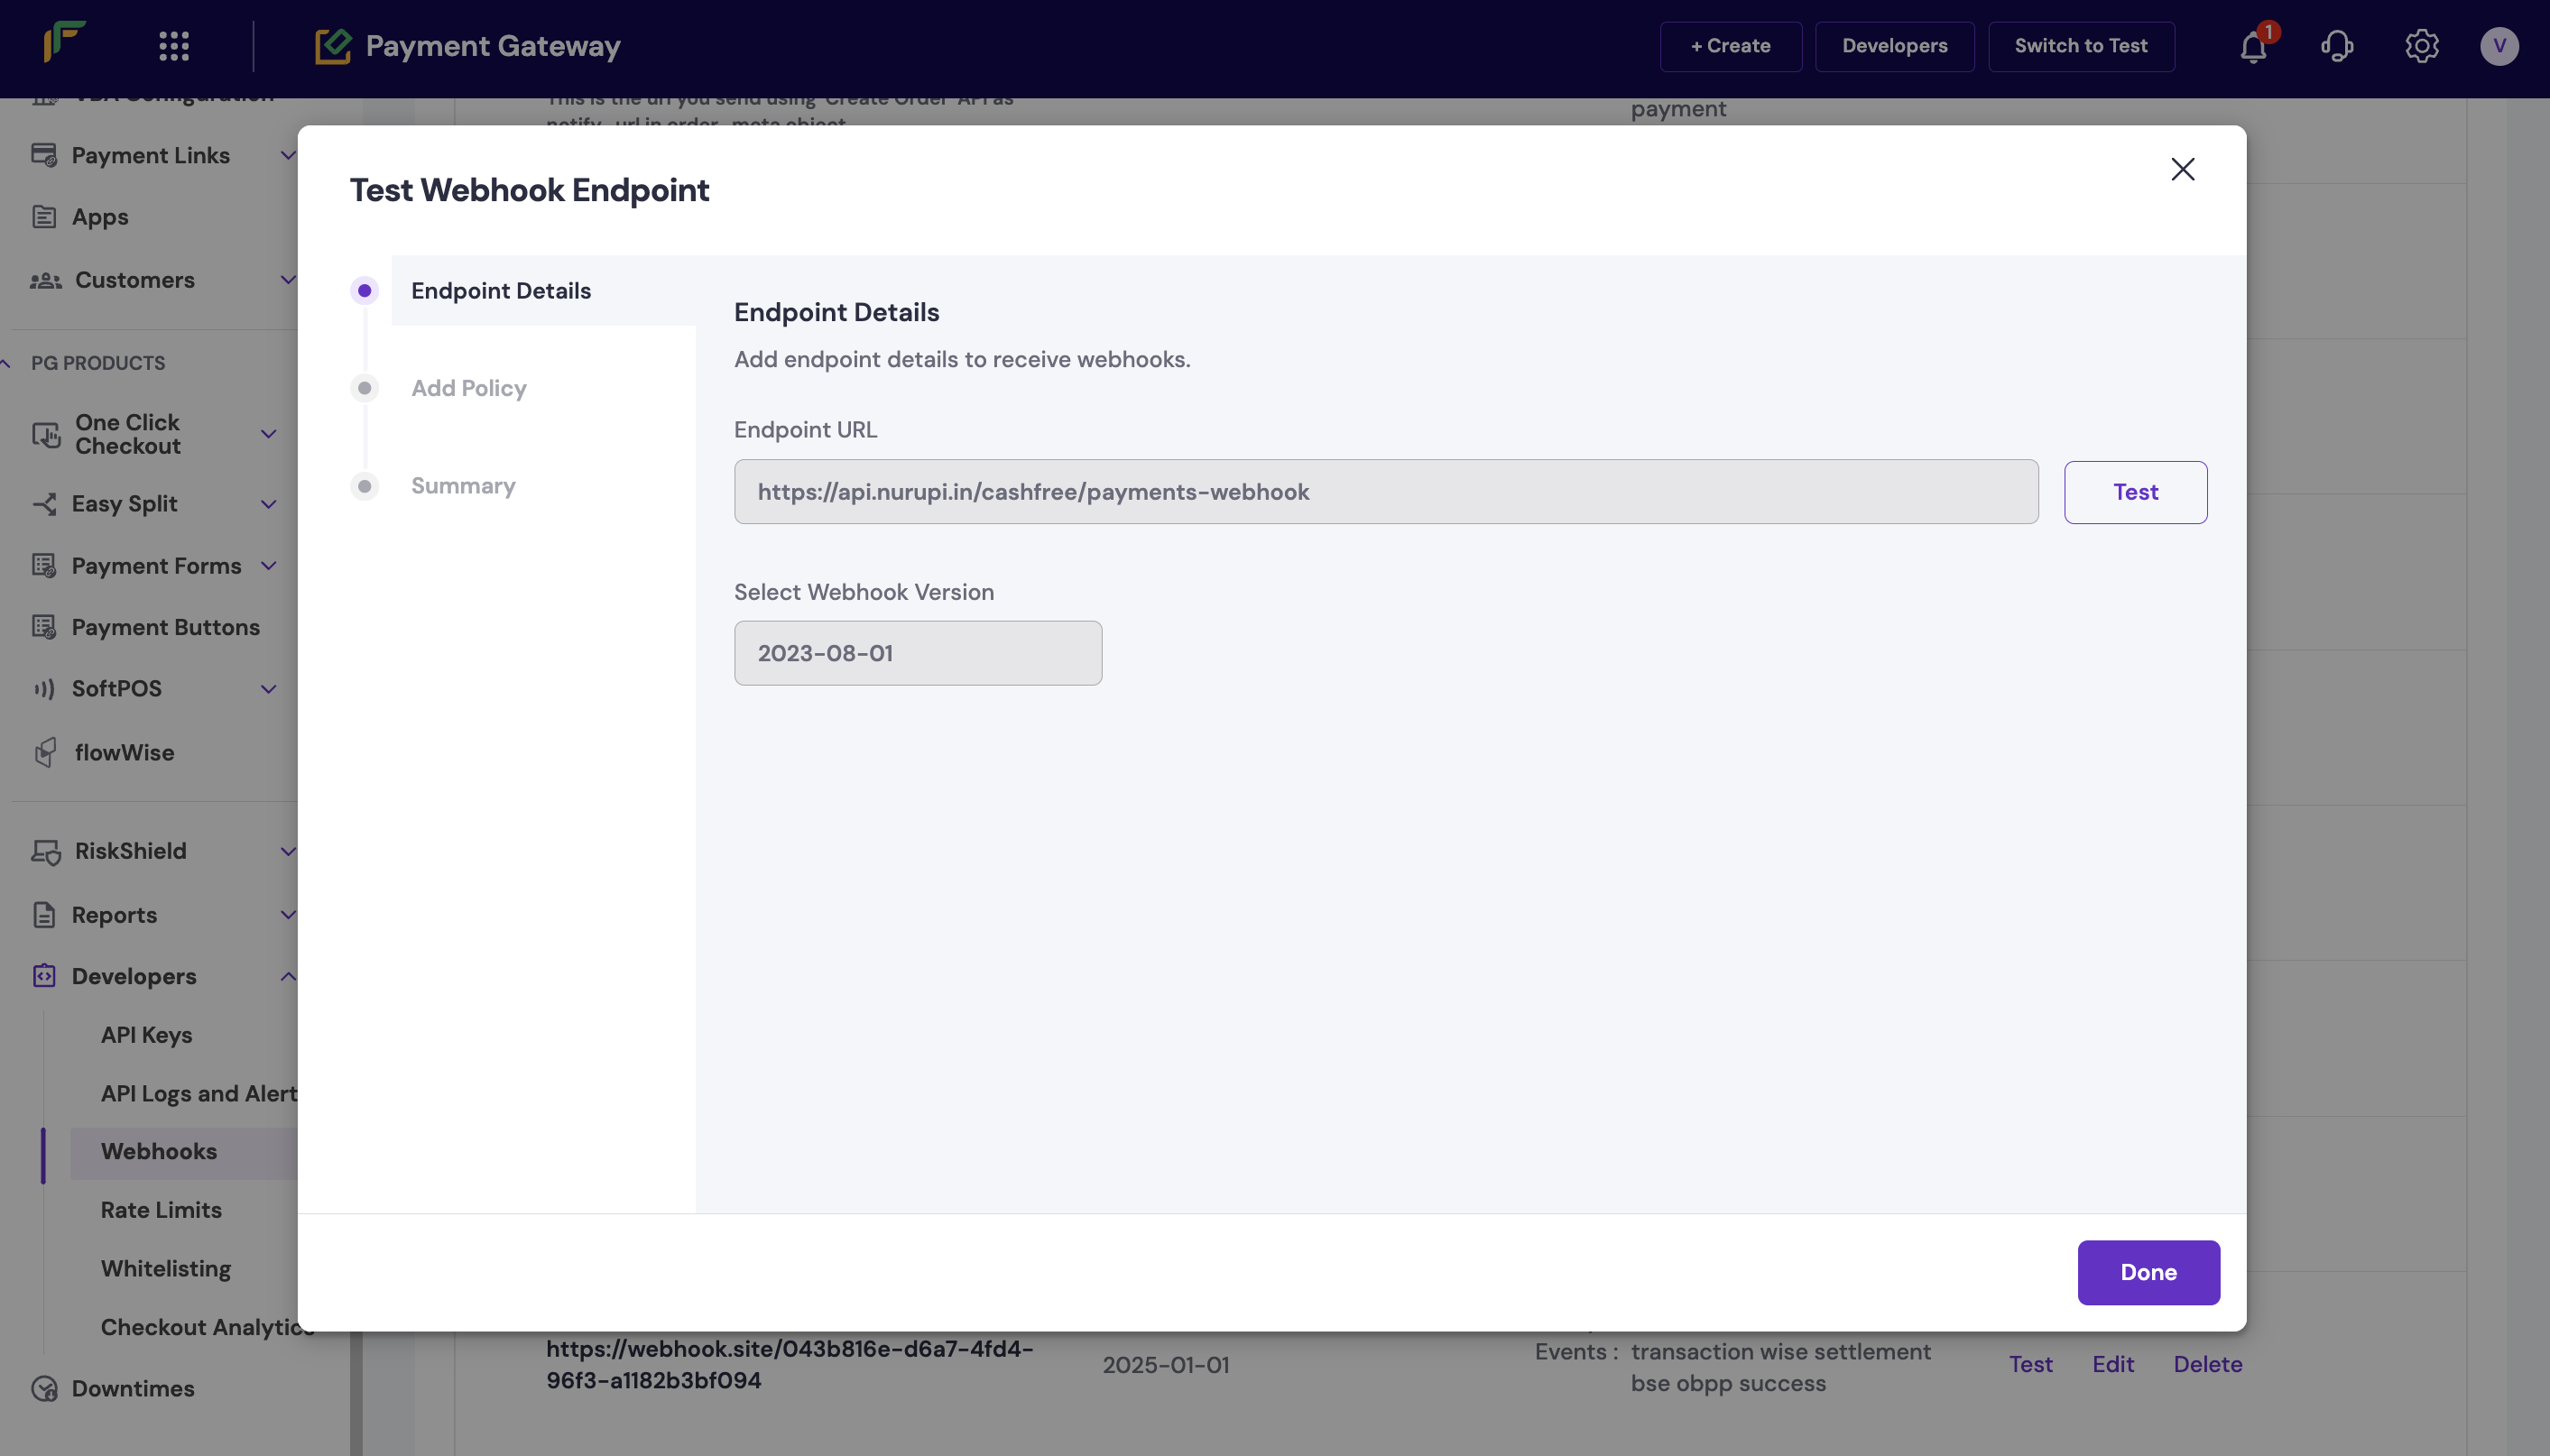
Test a webhook endpoint
You can test the URL at any time using the Test option.- Select Test on the webhook you want to verify.
- In the Test Webhook Endpoint pop-up, select Test.
- Select Done after you receive a success response.
Test a webhook endpoint
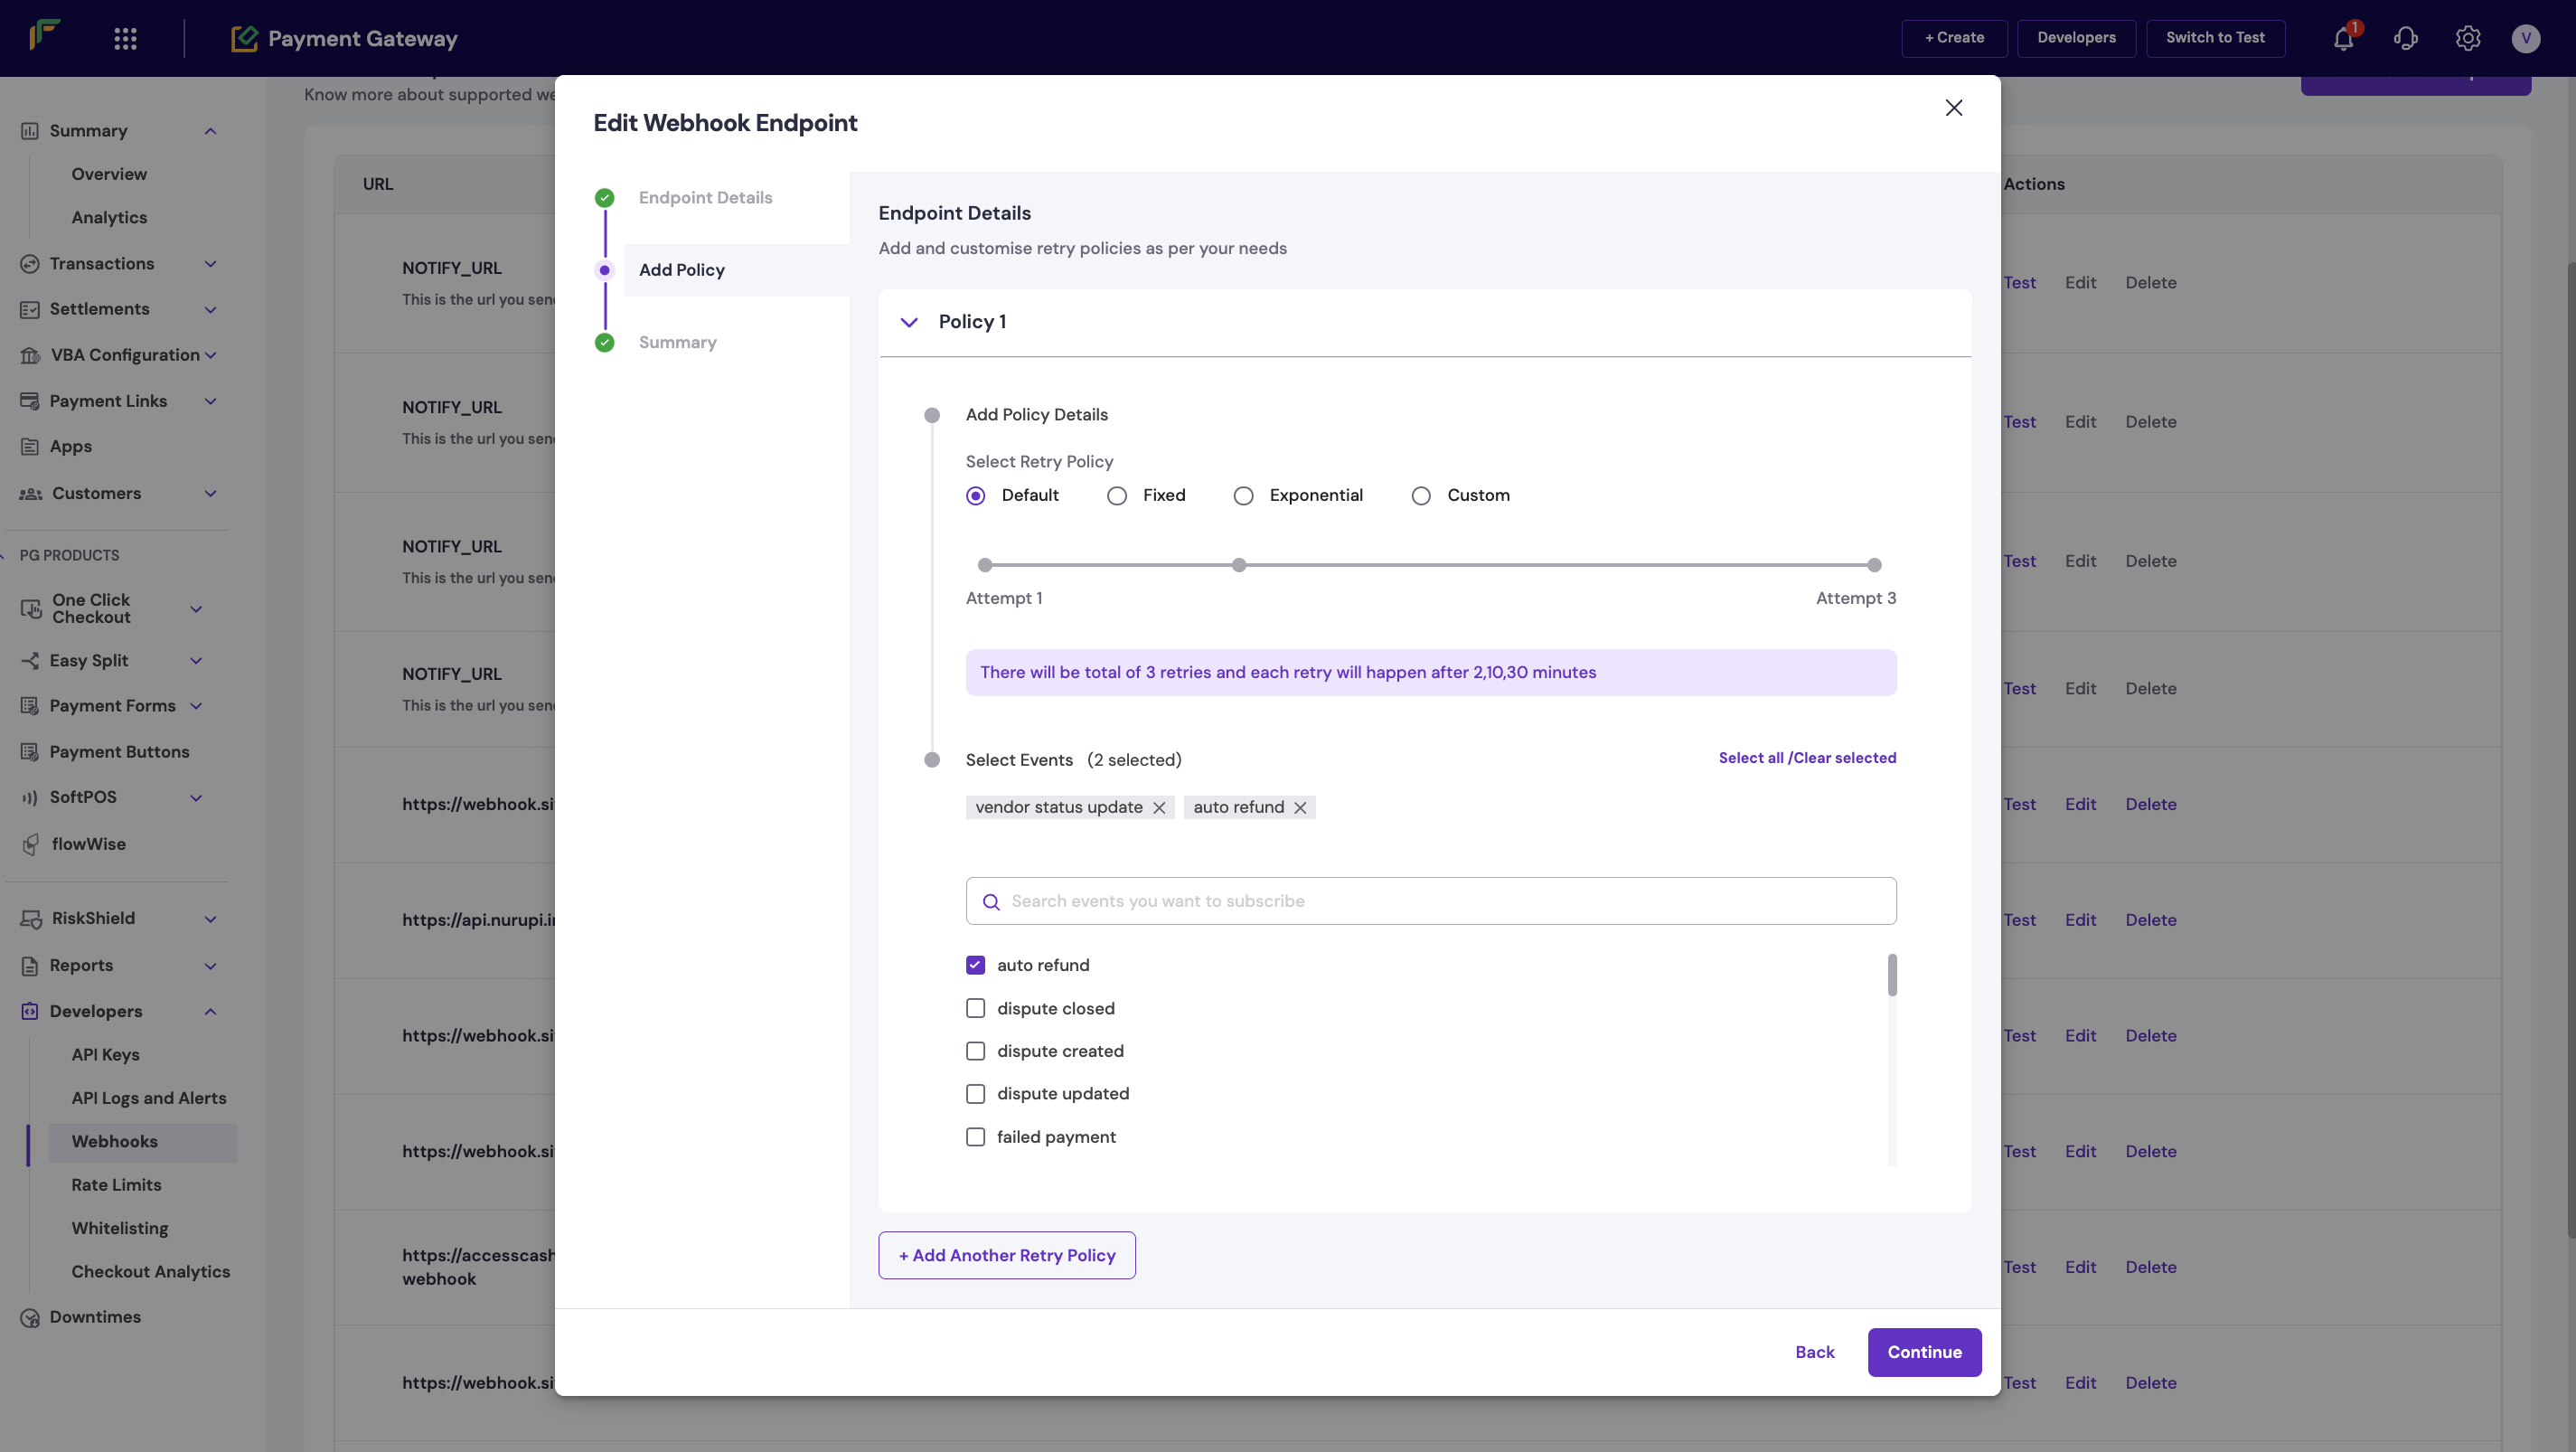
Edit a webhook endpoint
To edit a webhook:- Select Edit on the webhook you want to modify.
- Select the events you want to add or remove.
- Select Save.
Edit a webhook endpoint
Logs
The Logs section displays all webhook logs (successful or failed) on your dashboard.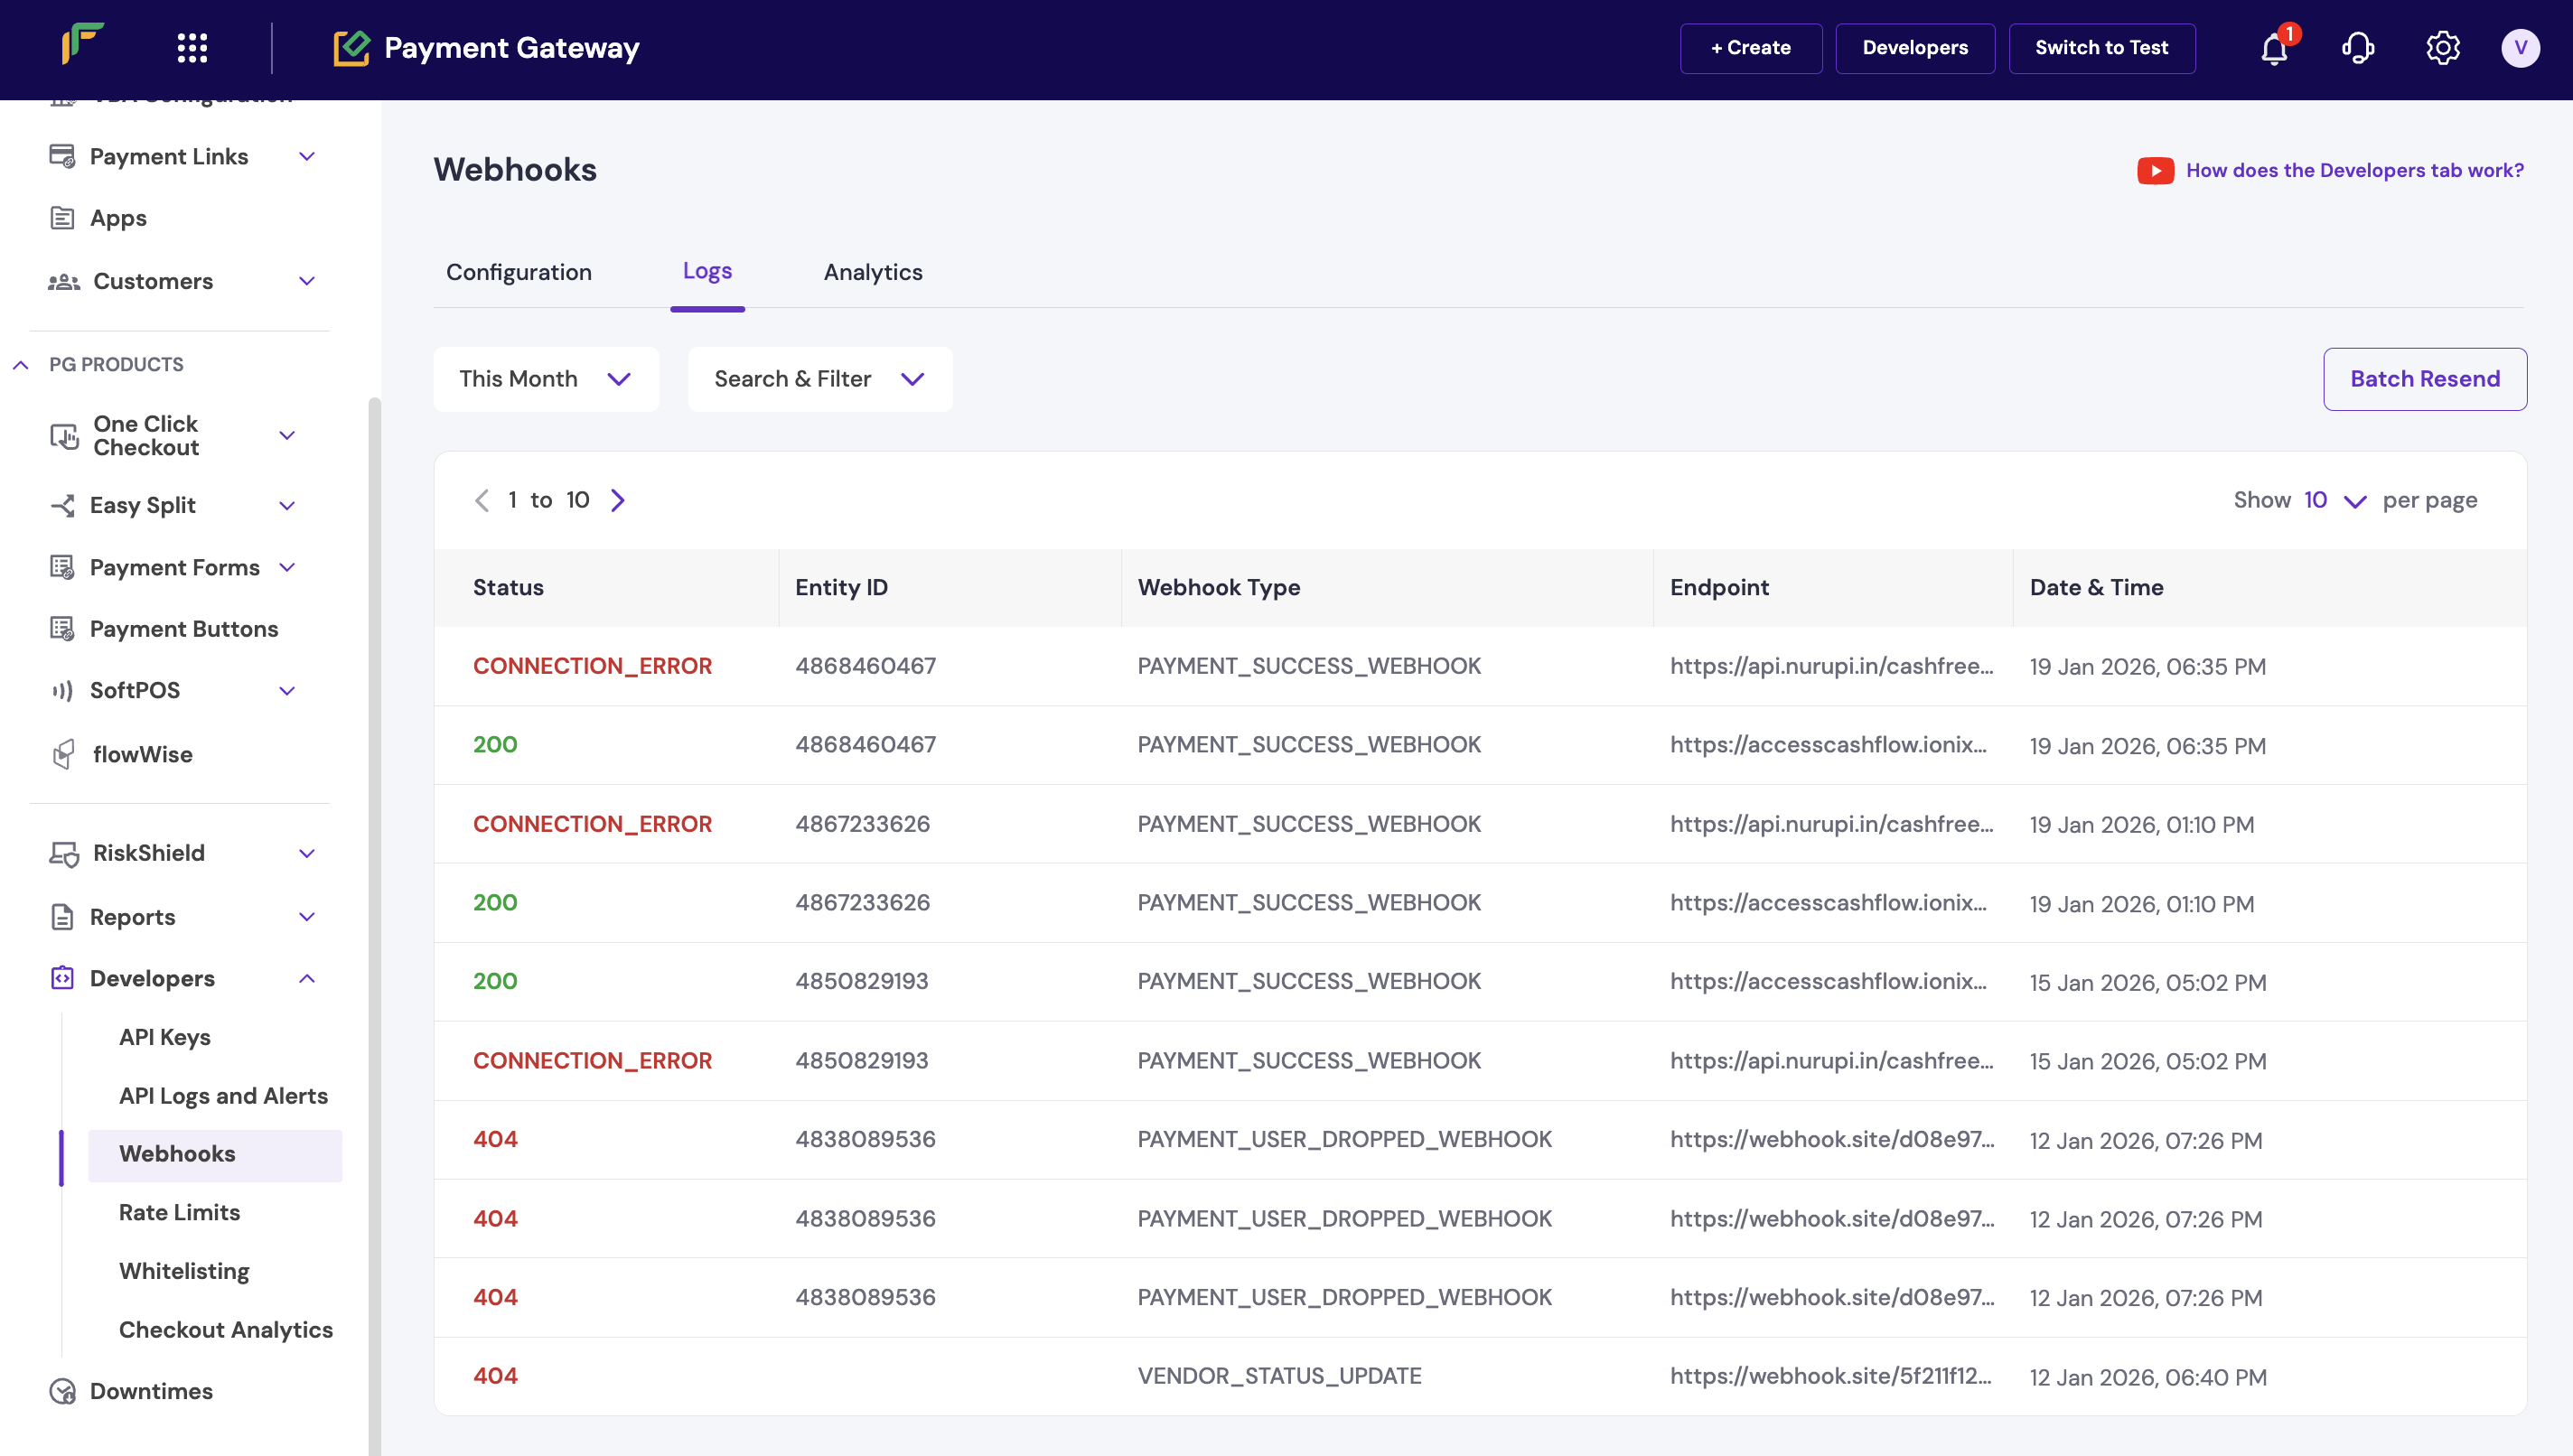
- Specify the date range to view logs for a particular period.
- Use the Search and Filter option to view specific logs. Enter the URL and select the required webhook type from the drop-down menu.
- Select a request to view details such as Message, Time, Version, Header Details, and Payload.
- To view only Success or Failed logs, navigate to the respective tabs.
Analytics
The webhook analytics feature provides contextual information on webhook metrics that help you track, monitor, and assess the success or failure of your webhooks. Metrics such as success rate and latency are available. To view analytics:- Specify the date range to view metrics for a particular period.
- Use the Search and Filter option to filter results. Enter the URL and select the required webhook type from the drop-down menu.
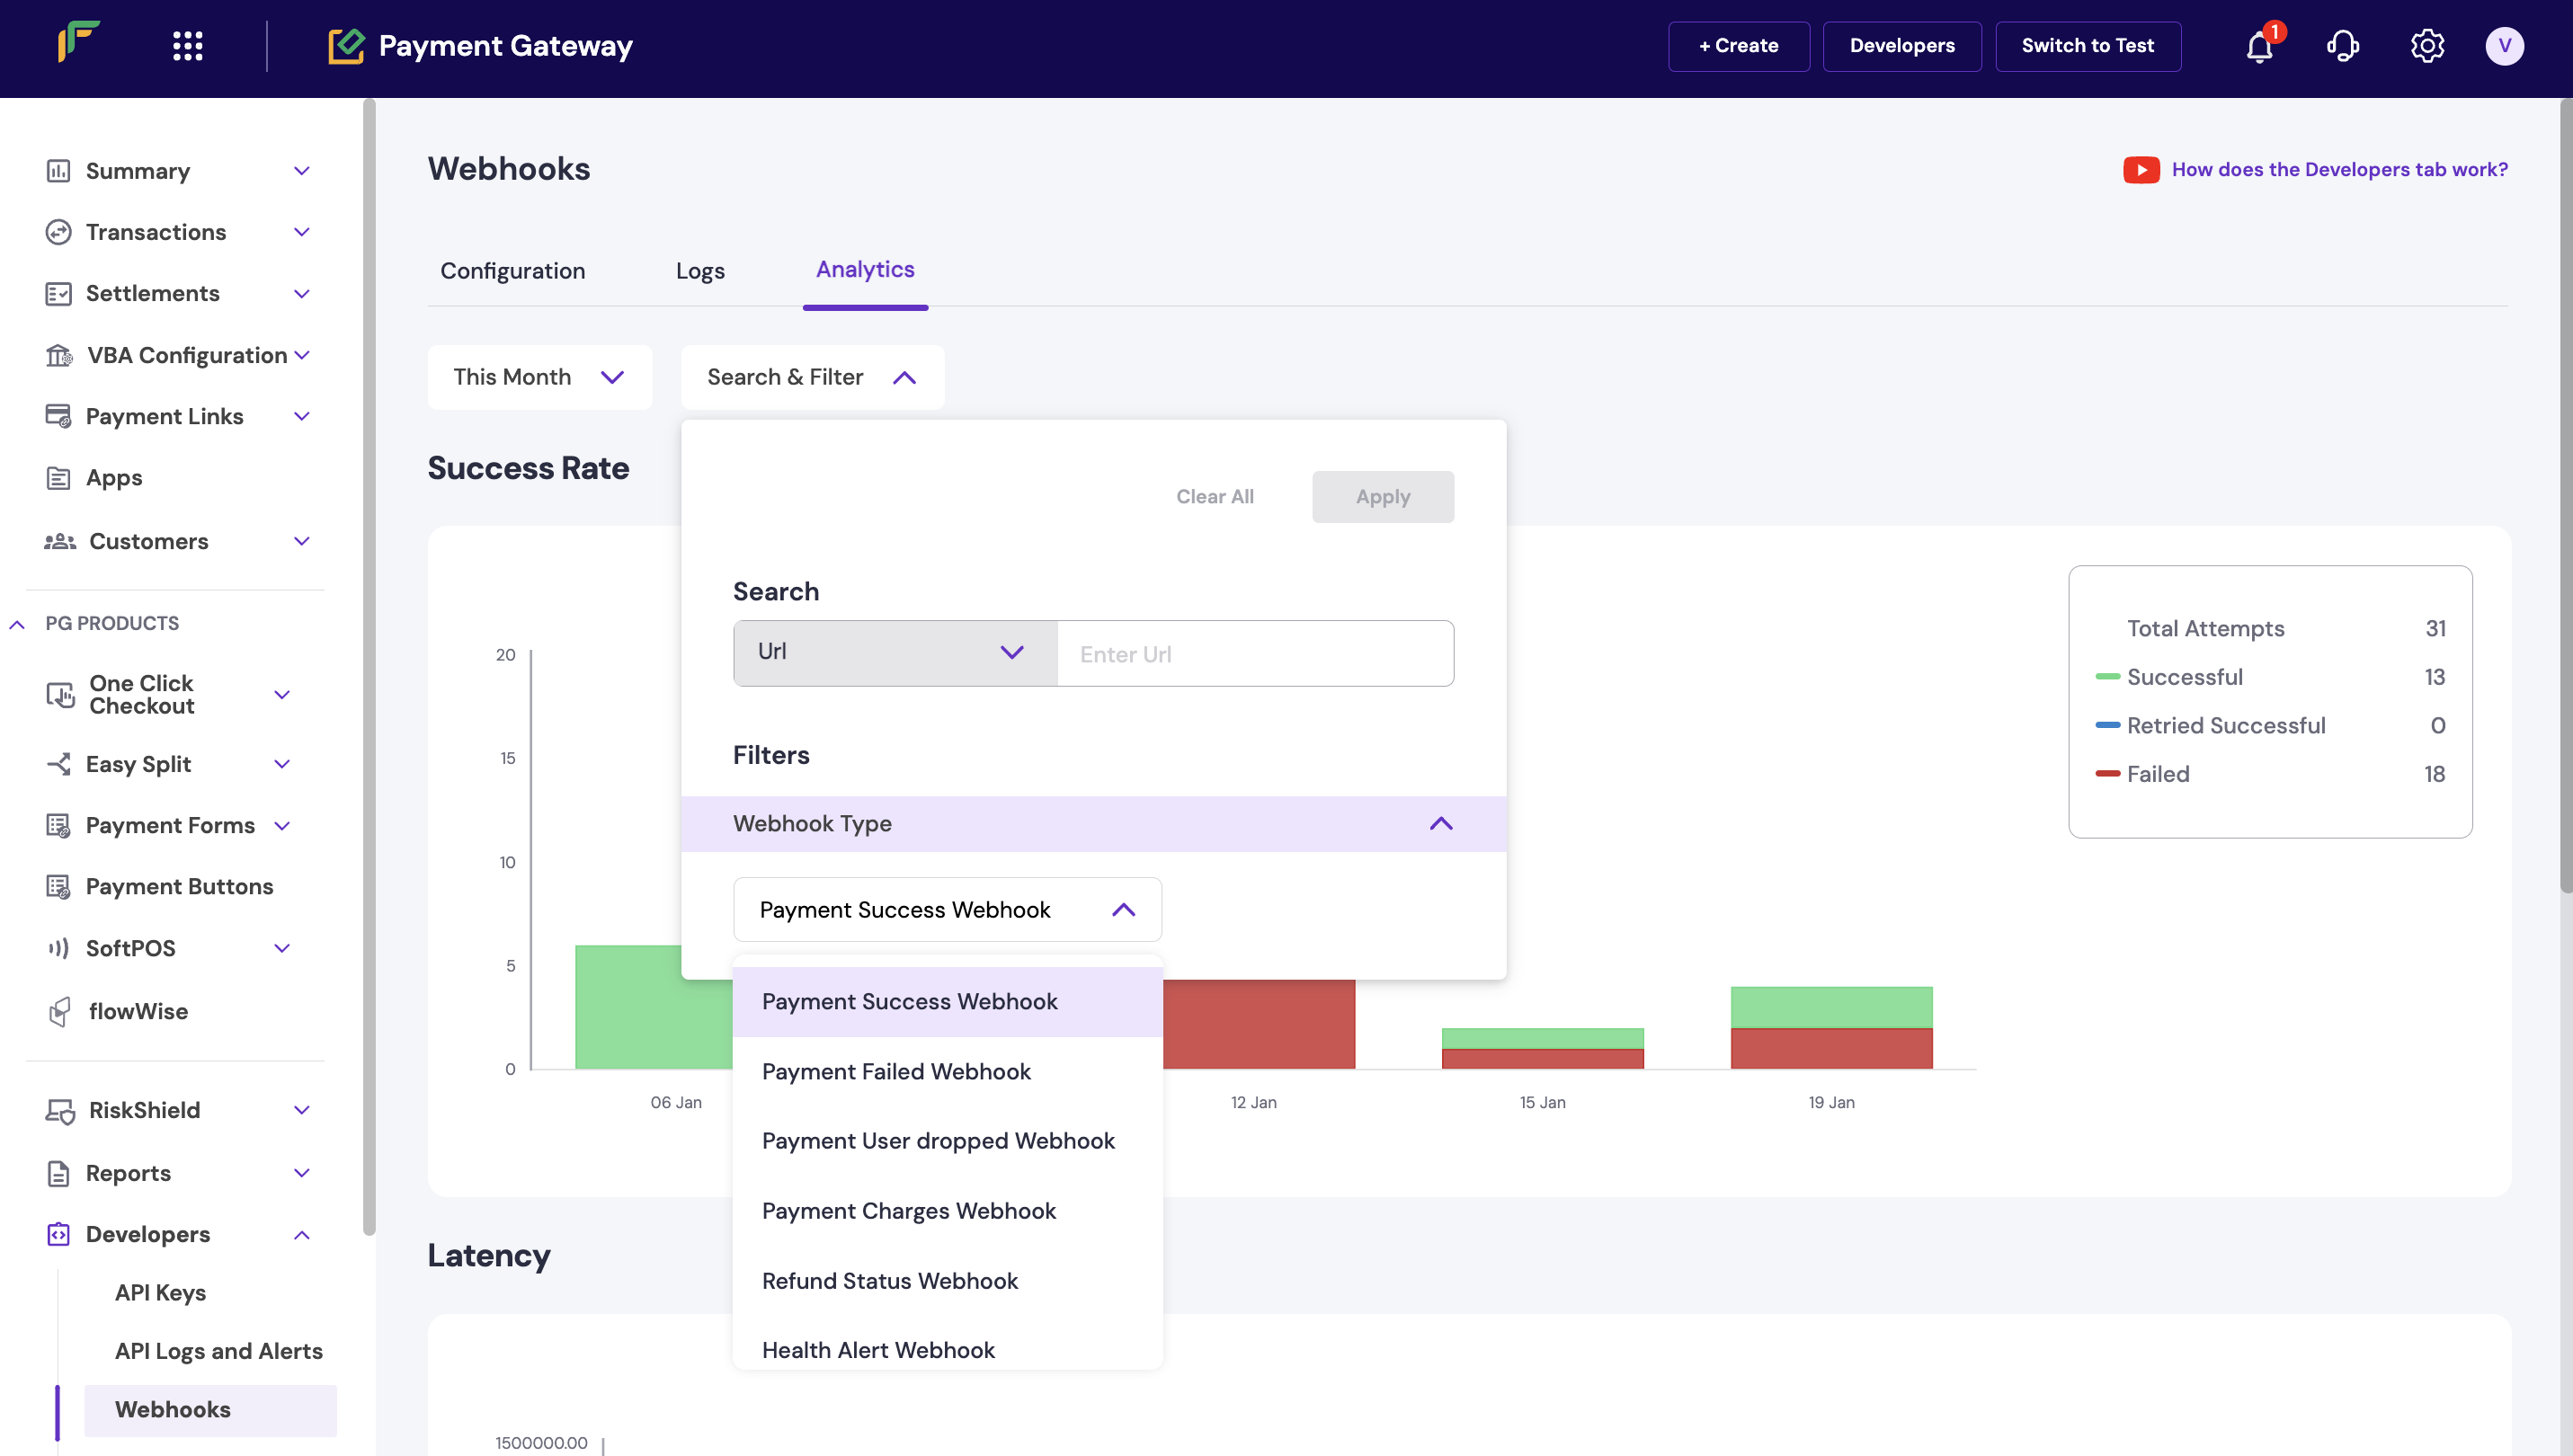
Search and Filter
Success rate
The success rate chart displays the webhook delivery status over time. The chart shows the following metrics:- Total Attempts: The total number of webhook delivery attempts.
- Successful: The count of webhooks delivered successfully on the first attempt.
- Retried Successful: The count of webhooks that succeeded after retry attempts.
- Failed: The count of webhooks that failed to deliver.