- Monitor transaction statuses and identify failure reasons.
- Track bank and network downtimes affecting payments.
- Review business trends and conversion rates through analytics.
- Troubleshoot common payment issues.
Quick reference
The following questions address common tasks and concerns when managing payments through the Merchant dashboard:Payment success rate factors
Payment success rate factors
Cashfree provides one of the highest success rates in the industry. However, transaction failures can occur due to factors outside Cashfree’s control.
- User-related issues: Invalid CVV, invalid OTP, failed 2-factor authentication, or card not enabled for online transactions.
- Bank or network issues: Issuer bank downtime such as SBI, HDFC, Kotak or card network downtime such as NPCI, Visa, Mastercard.
Transaction status checking
Transaction status checking
You can track whether a transaction was successful or failed directly from the dashboard. Complete these steps to check transaction status and failure reasons: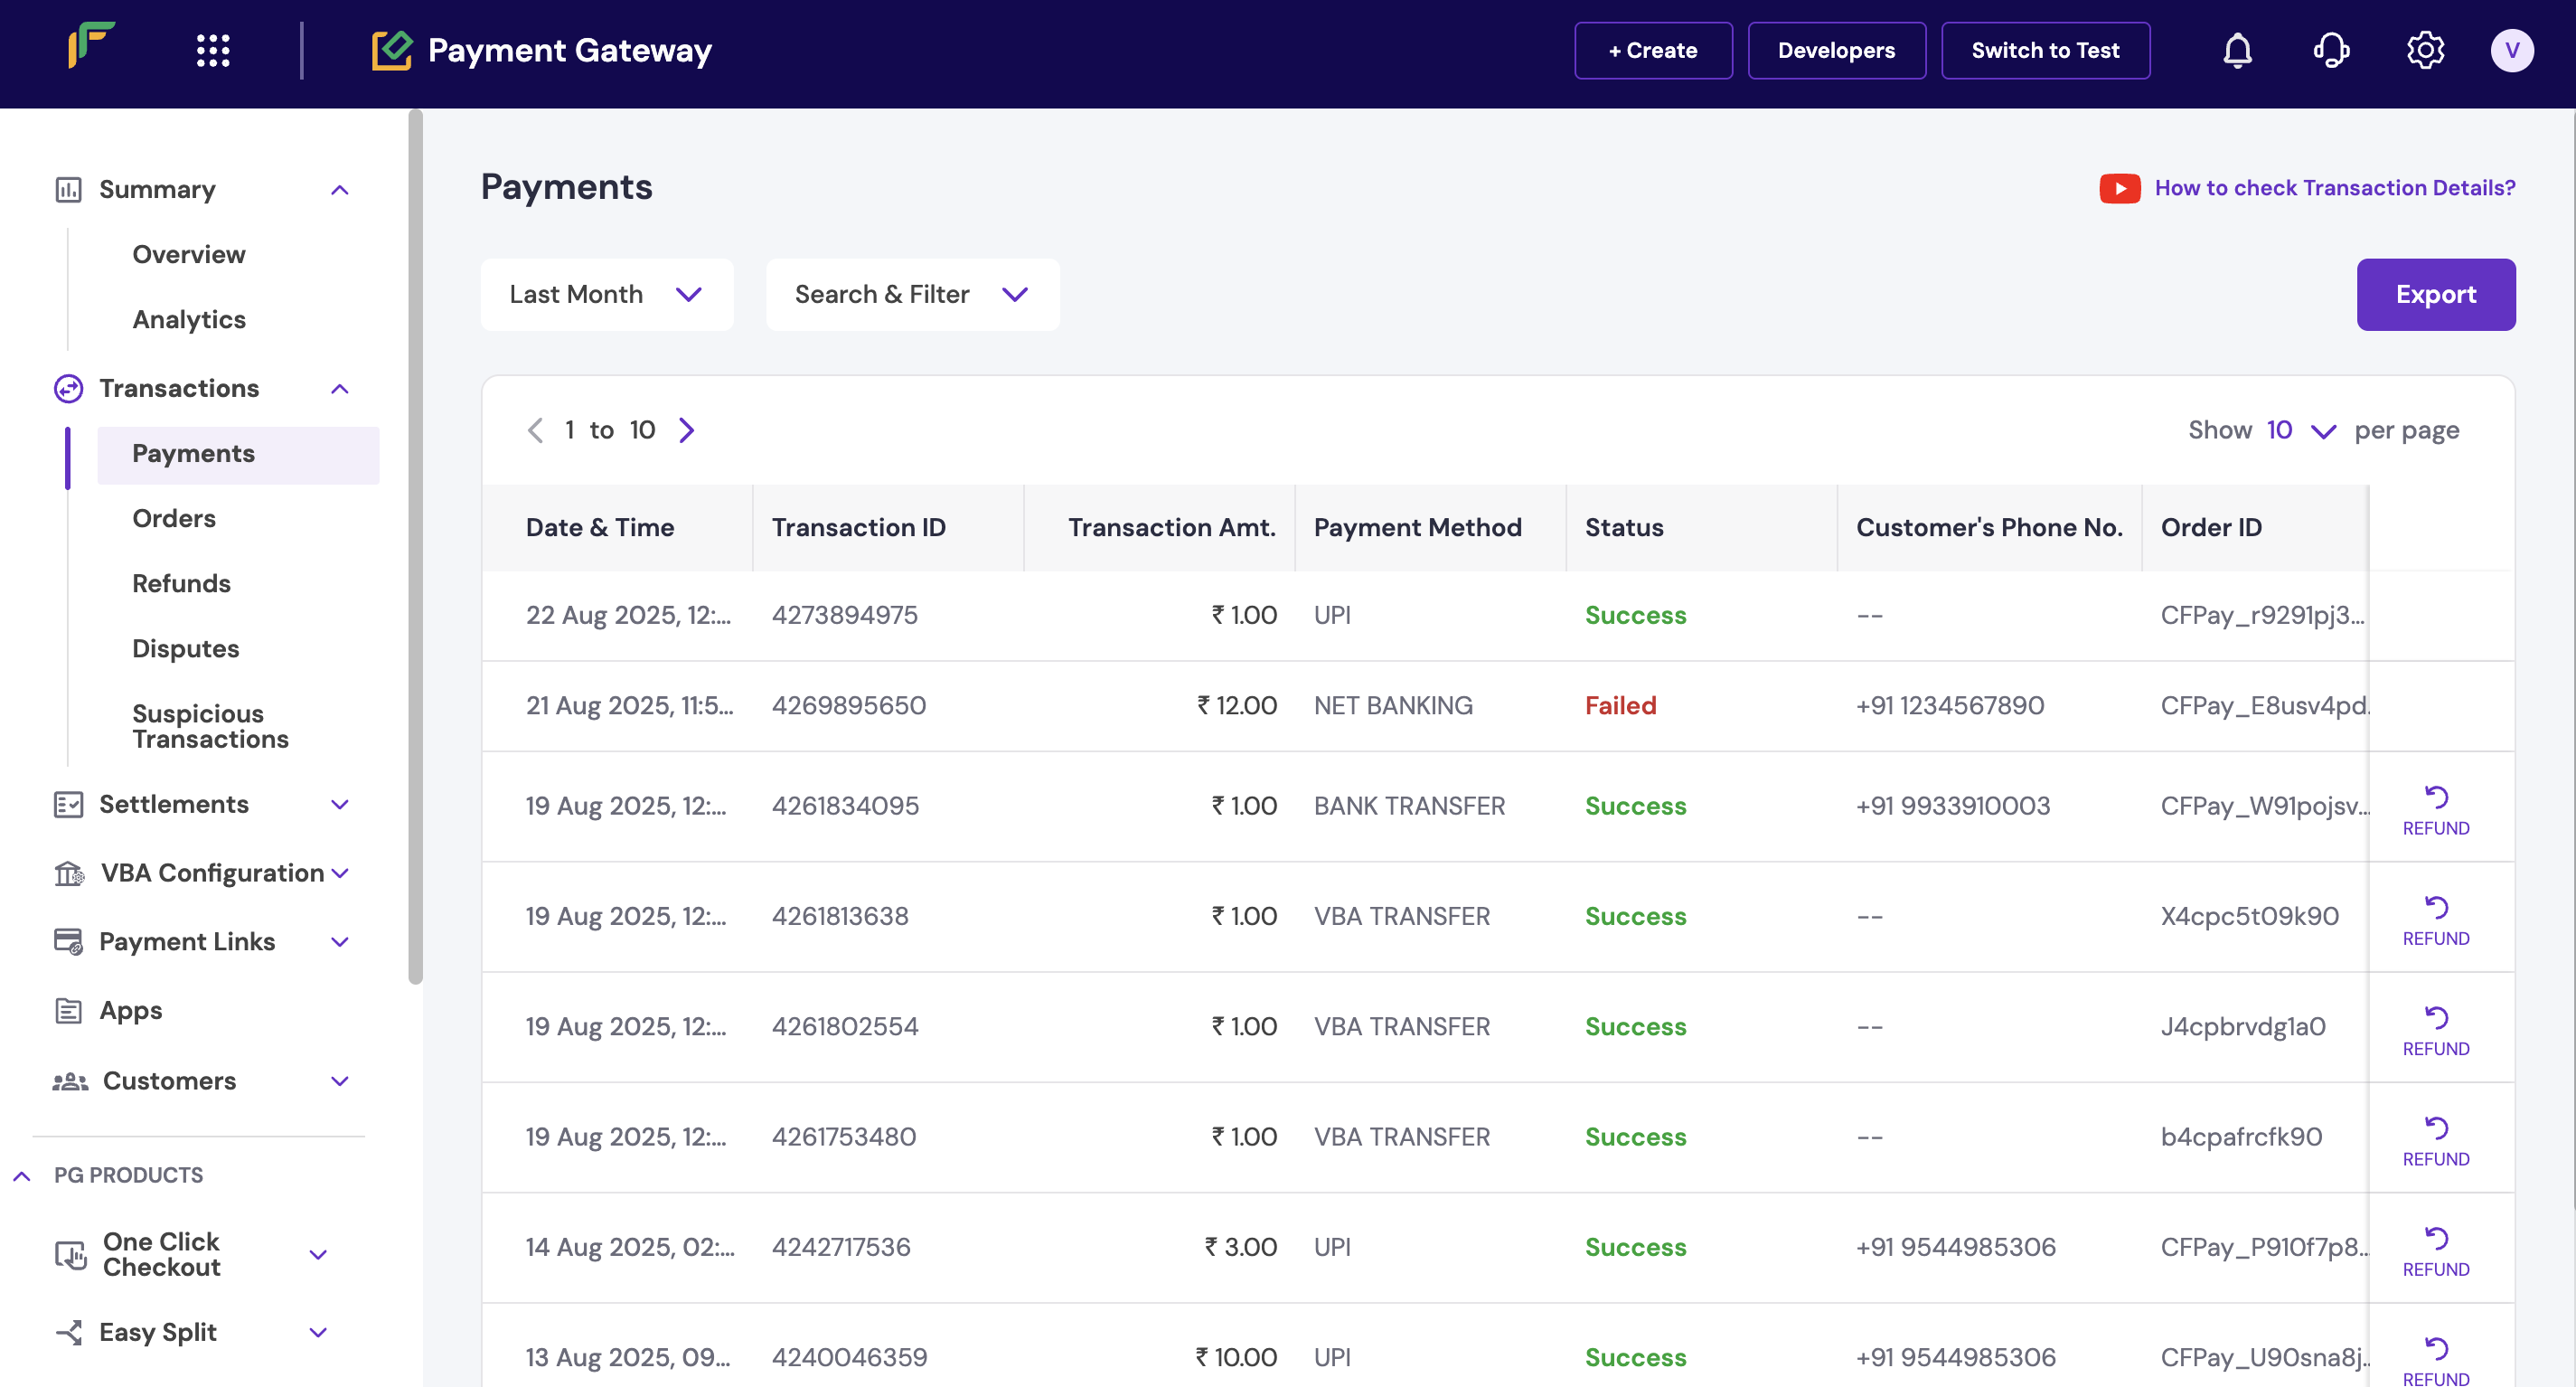
- Log in to the Merchant Dashboard.
- Go to Payment Gateway > Transactions > Payments.
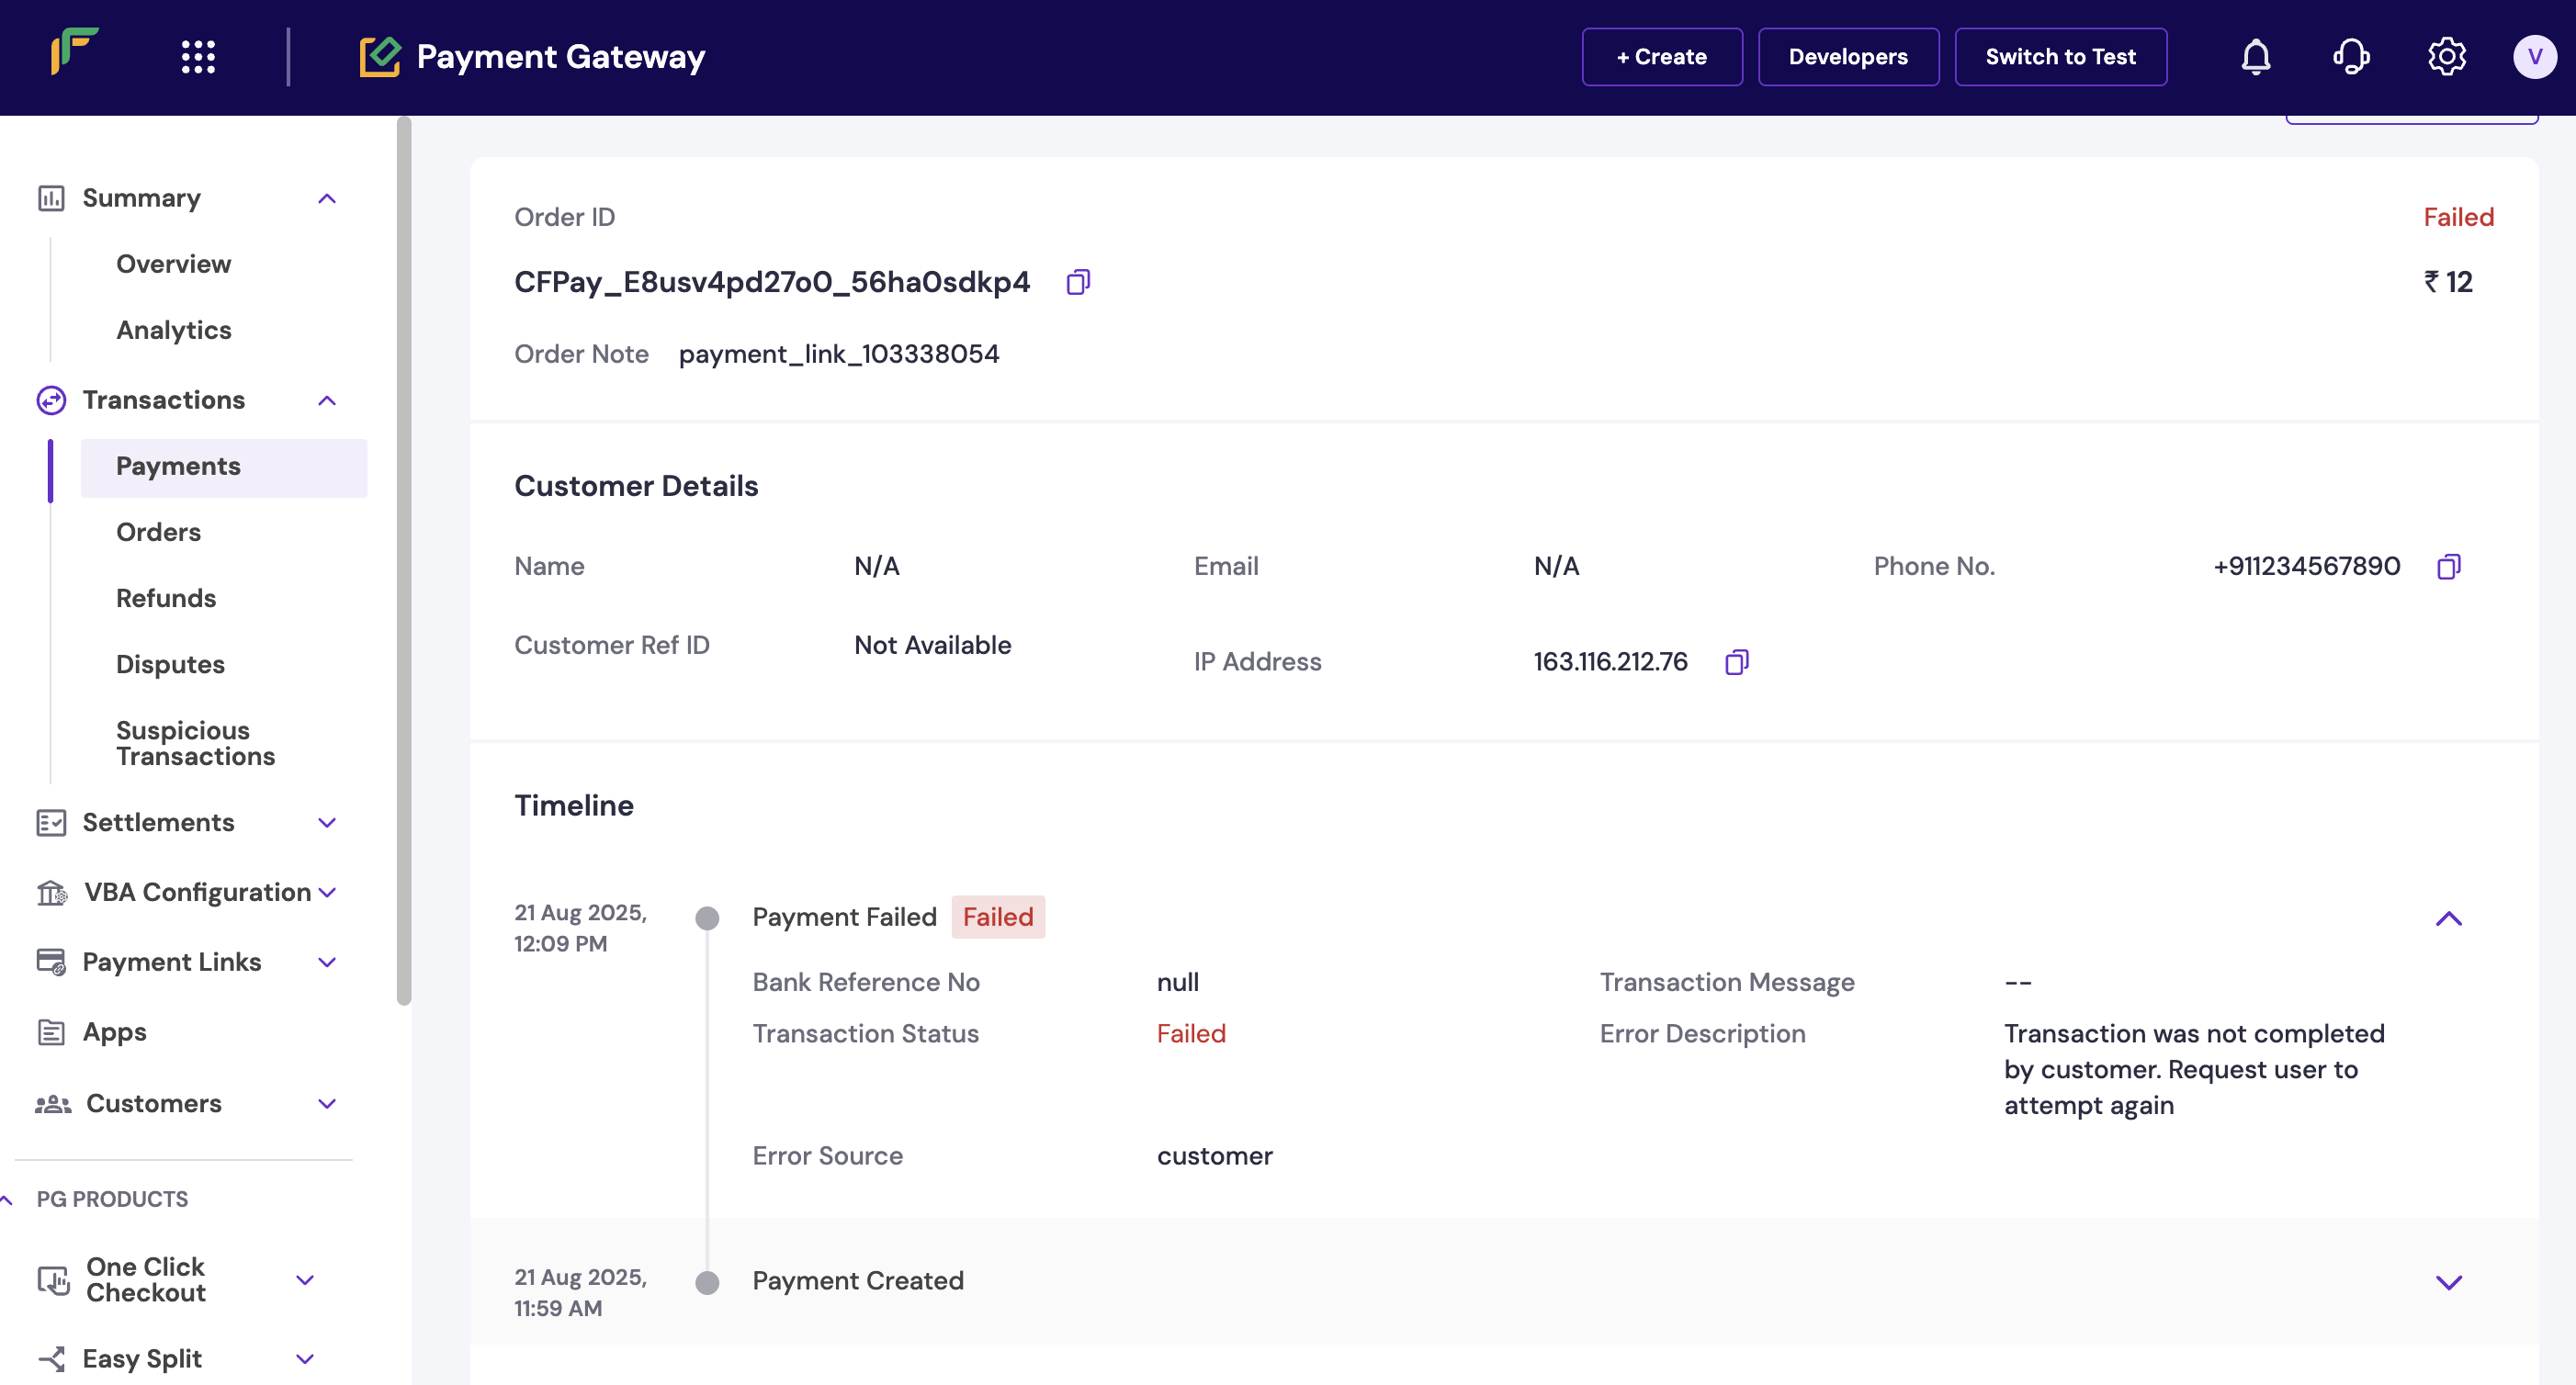
- Click on a Transaction ID to view complete details, including:
- Error description
- Error source
- Failure reason
Check transaction details in the dashboard
Detailed transaction view with error details
Downtime information tracking
Downtime information tracking
The dashboard provides real-time visibility into active, upcoming, and resolved downtimes. Complete these steps to track downtime information: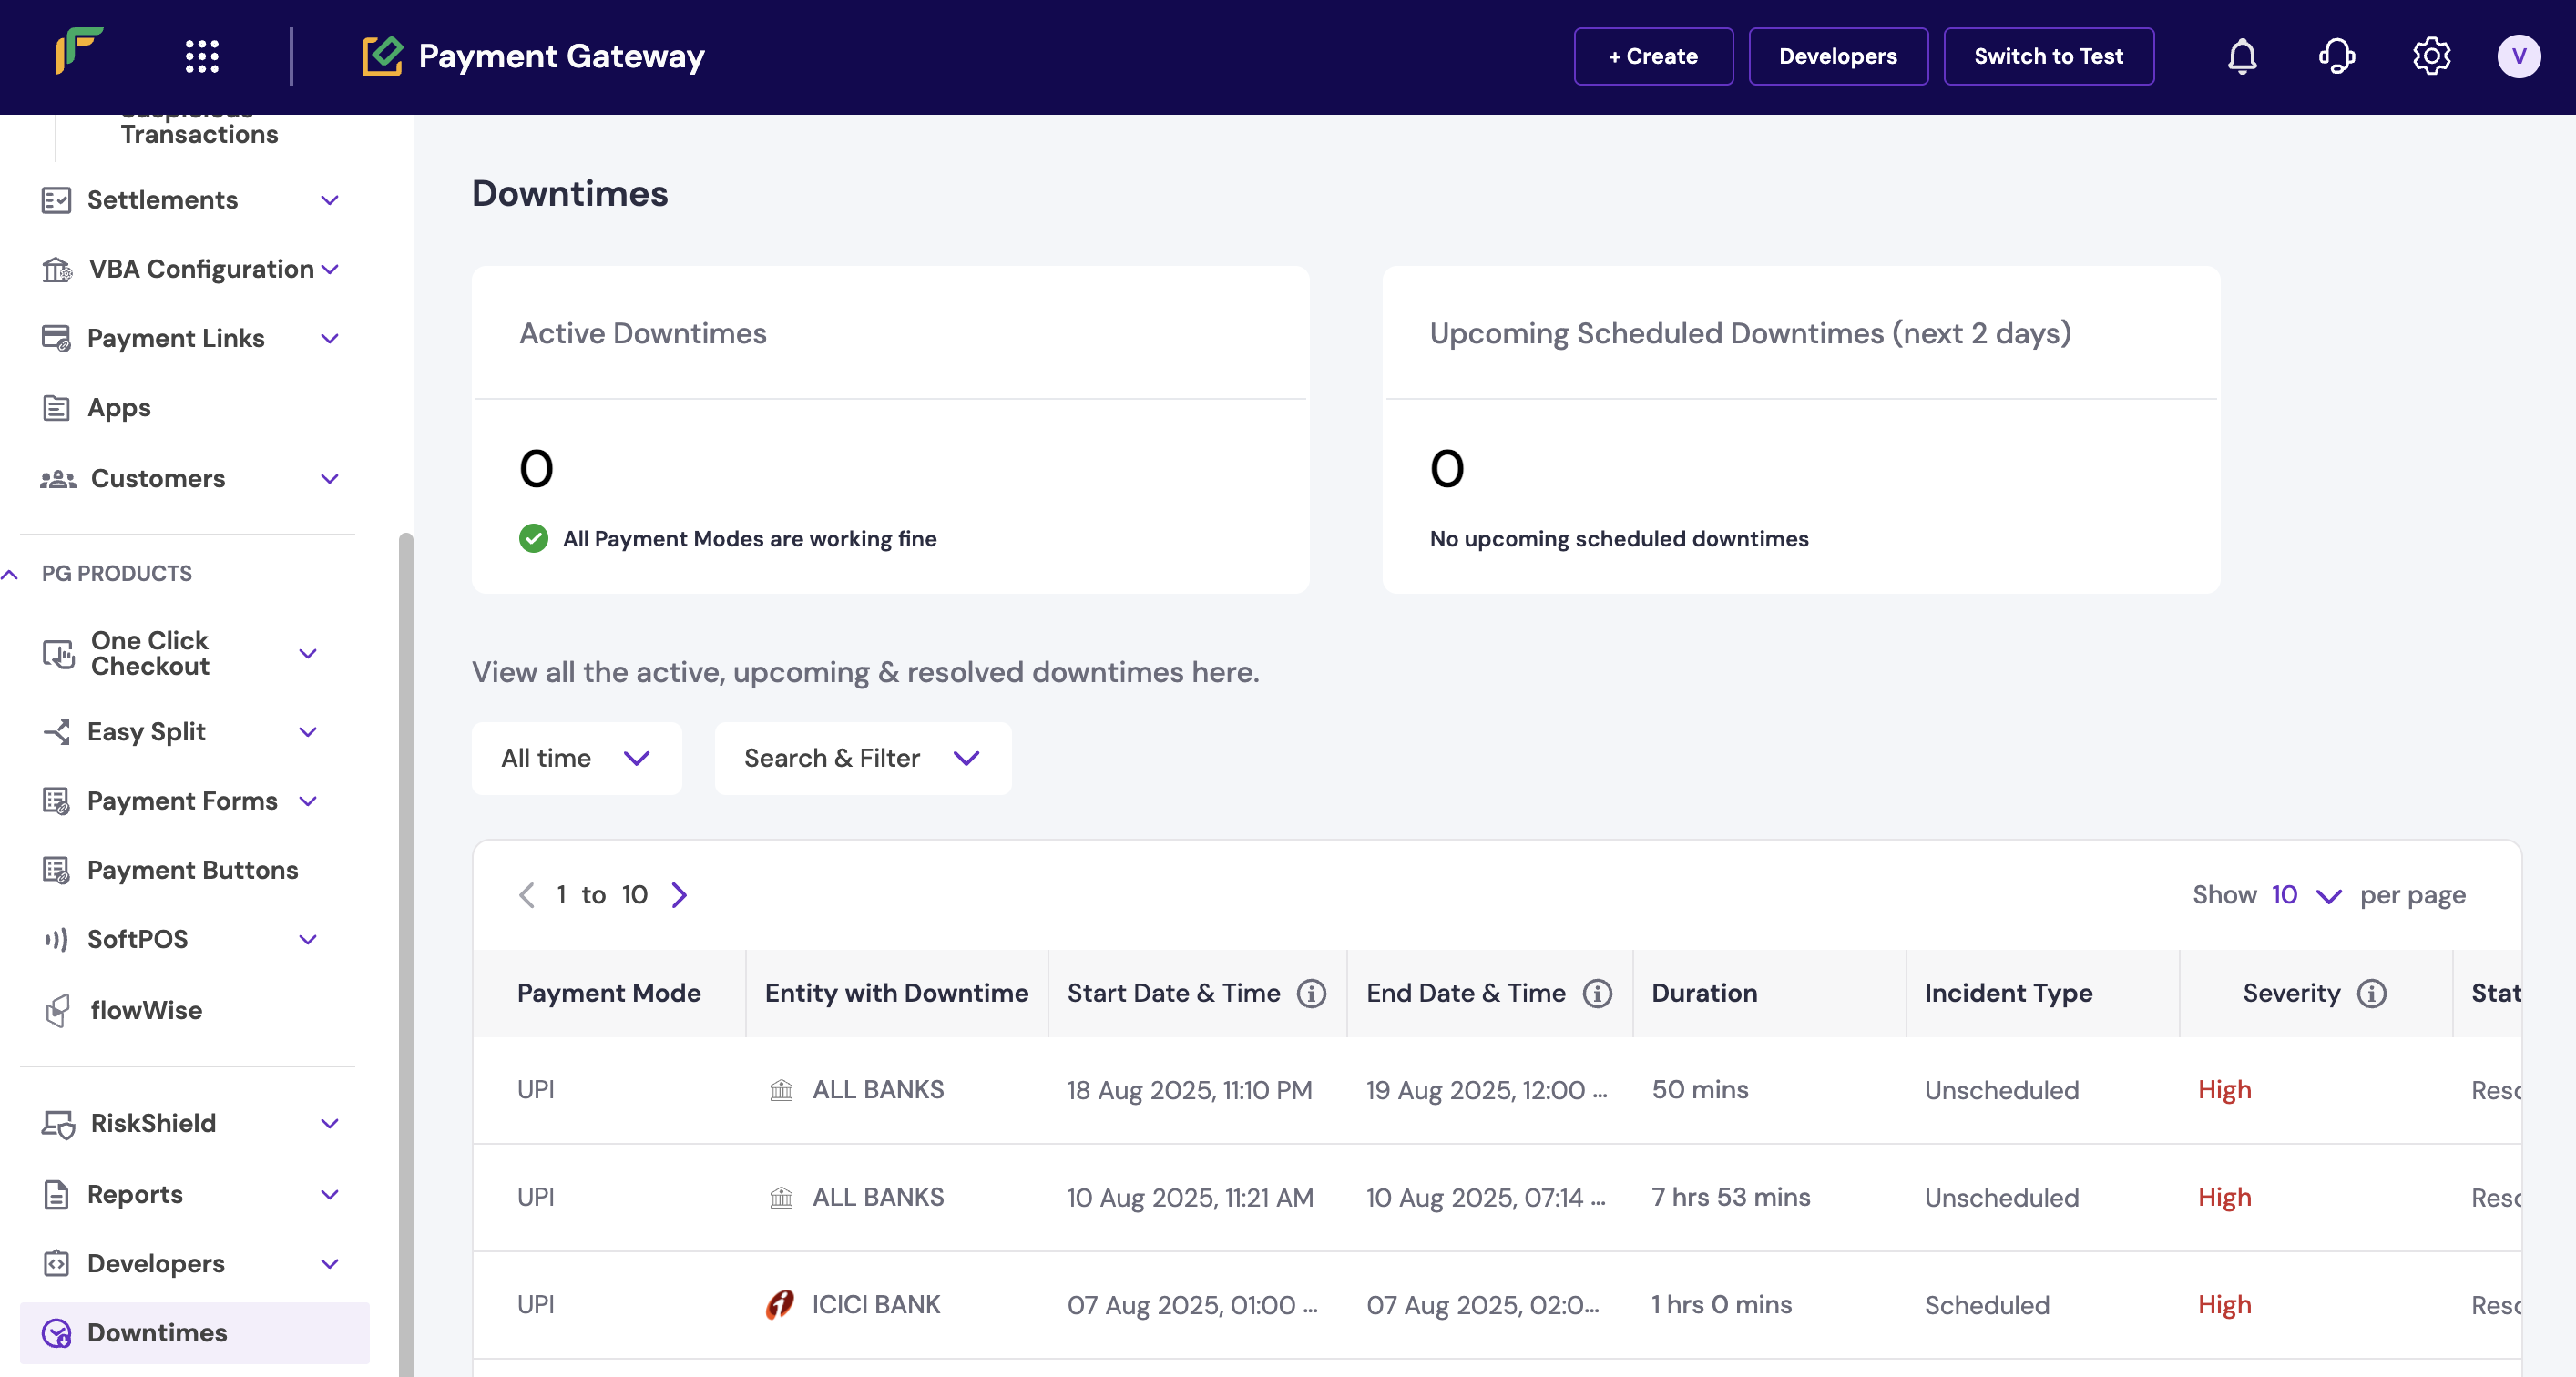
- Log in to the Merchant Dashboard.
- Go to Payment Gateway.
- Scroll down to the Downtime section.
- Click to view complete downtime details.
Downtime section in dashboard
- Active downtimes: Current issues affecting payments.
- Upcoming downtimes: Scheduled maintenance windows.
- Resolved downtimes: Recently fixed issues.
Configure email notifications to receive real-time downtime alerts and minimise impact on your business operations.
Payment analytics access
Payment analytics access
The Analytics dashboard provides a consolidated view of your business performance, including conversion rates and payment failures. Complete these steps to access the analytics dashboard: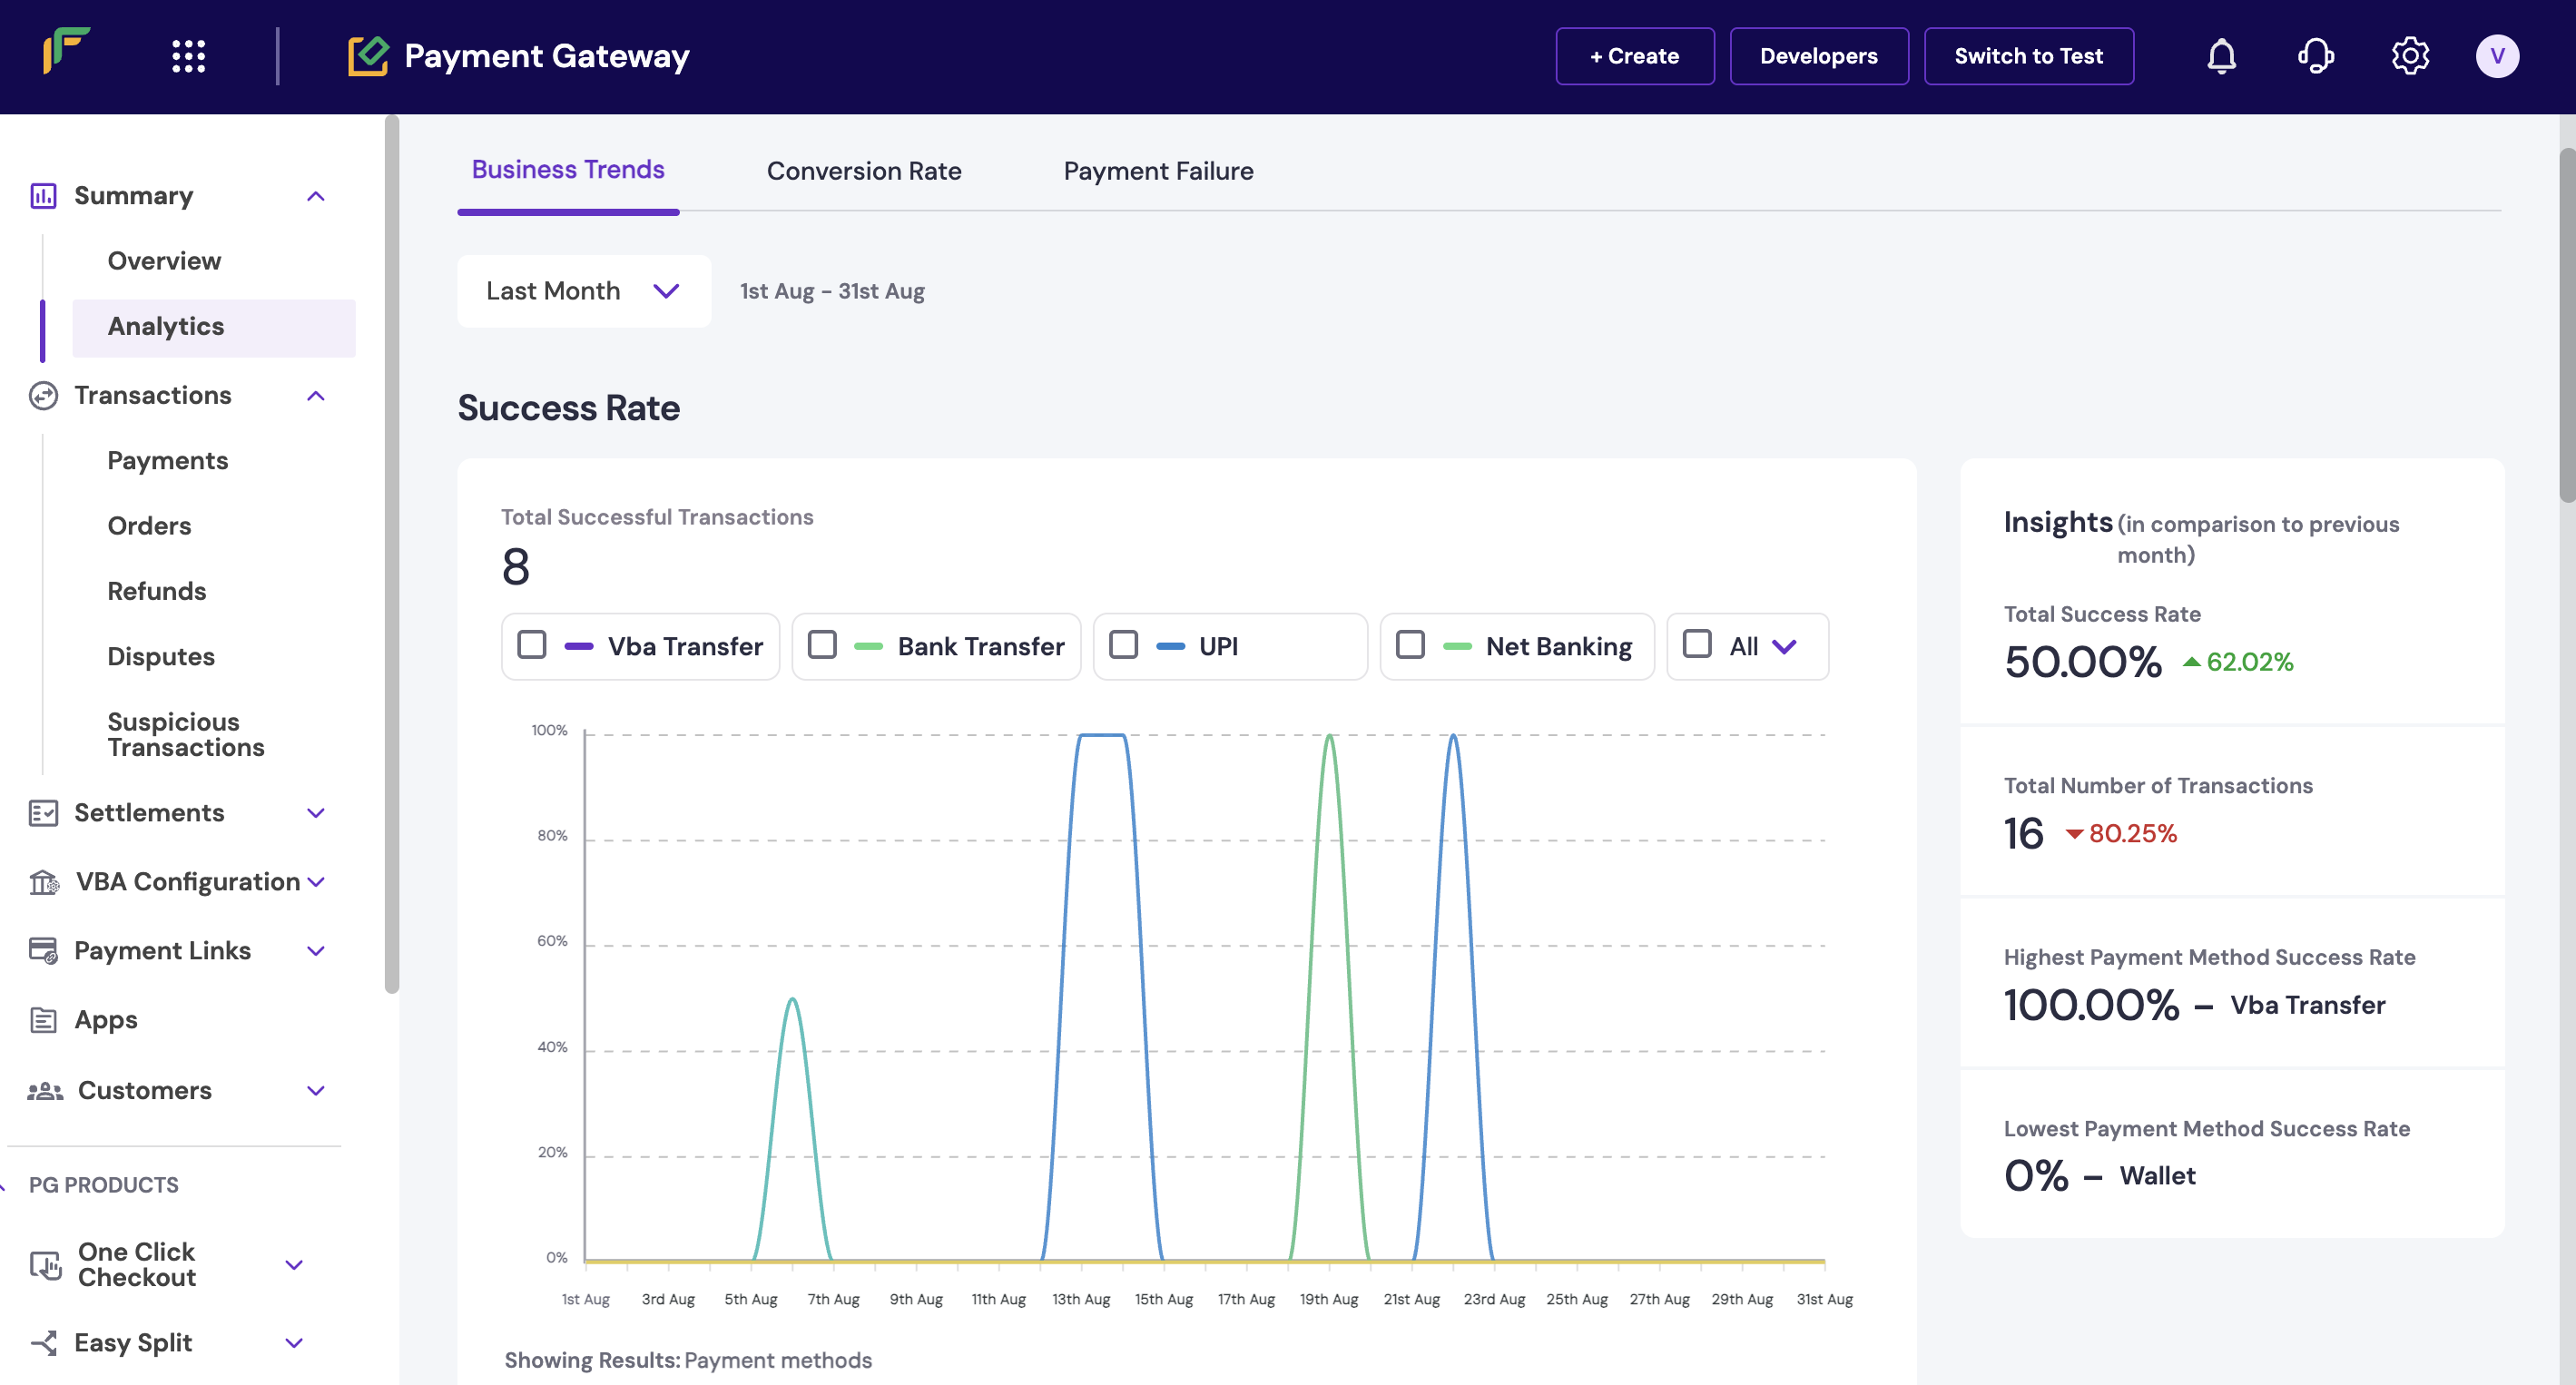
- Log in to the Merchant Dashboard.
- Go to Payment Gateway > Transactions > Analytics.
- Review trends for:
- Conversion rate
- Business volume
- Payment failures
- Success rate patterns
Analytics dashboard overview
- Conversion metrics: Success rates and completion rates.
- Volume trends: Transaction amounts and counts over time.
- Failure analysis: Common failure reasons and patterns.
- Performance insights: Peak hours and method preferences.
Troubleshooting frequent payment failures
Troubleshooting frequent payment failures
If you notice increased payment failures, follow these troubleshooting steps to identify and resolve issues:
- Check downtime status: Review the downtime section to identify any active bank or network issues affecting payments.
- Analyse failure patterns: Use the analytics dashboard to identify common failure reasons and affected payment methods.
- Review transaction details: Check individual failed transactions for specific error codes and failure sources.
- Monitor success rates: Set up success rate alerts to receive notifications when rates drop below acceptable thresholds.
Monitoring and alerts setup
Monitoring and alerts setup
You can configure various monitoring and alert systems to stay informed about payment performance. Complete these steps to set up monitoring:
- Log in to the Merchant Dashboard.
- Go to Payment Gateway > Settings > Notifications.
- Configure alerts for:
- Success rate drops
- Downtime notifications
- Transaction volume changes
- Failed payment thresholds
Next steps
After familiarising yourself with payment monitoring basics:- Set up payment webhooks for real-time transaction notifications.
- Configure automated monitoring for success rate alerts.
- Explore comprehensive reporting for business insights.
- Implement error handling best practices in your integration.